
Beschreibung
Einführung des True Strength Index (TSI) Indikators, ein leistungsstarkes Werkzeug, das entwickelt wurde, um Ihre Handelsstrategie zu verbessern, indem es klare Einblicke in das Marktmomentum und die Trendstärke bietet.
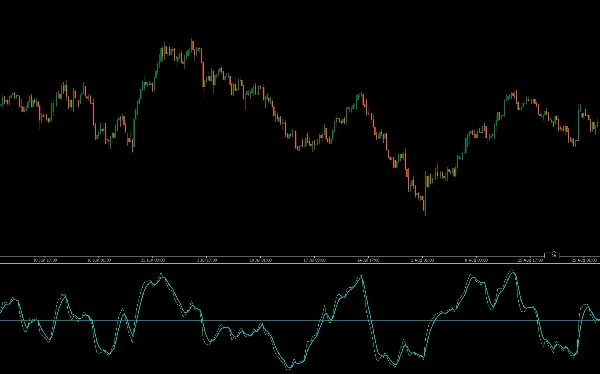
Der TSI-Indikator misst die zugrunde liegende Stärke der Kursbewegungen und glättet Marktrauschen, um Ihnen ein genaueres Bild der Trendrichtung zu geben. Durch die Hervorhebung von überkauften und überverkauften Zuständen hilft Ihnen der TSI, potenzielle Umkehrpunkte zu identifizieren und Trendfortsetzungen zu bestätigen.
TSI verwendet gleitende Durchschnitte des zugrunde liegenden Momentums eines Finanzinstruments. Momentum gilt als führender Indikator für Kursbewegungen, und ein gleitender Durchschnitt hinkt dem Kurs typischerweise hinterher. Der TSI kombiniert diese Eigenschaften, um eine Anzeige von Kurs und Richtung zu schaffen, die besser mit Marktbewegungen synchronisiert ist als entweder Momentum oder gleitender Durchschnitt.
Perfekt für Trader, die ihre Analyse verfeinern und ihre Entscheidungsfindung verbessern möchten, bietet der TSI-Indikator eine zuverlässige und intuitive Möglichkeit, Marktdynamiken zu beurteilen. Erweitern Sie Ihr Trading-Toolkit mit dem True Strength Index für überlegene Handelsleistungen.
- Trenderkennung: Ein positiver TSI zeigt einen Aufwärtstrend an, während ein negativer TSI auf einen Abwärtstrend hindeutet.
- Momentumstärke: Er misst, wie stark sich ein Trend bewegt, wobei höhere Werte auf ein stärkeres Momentum hinweisen.
- Potenzielle Umkehrsignale:
-
- Kreuzungen: Ein Signal-Linien-Kreuz nahe der Nulllinie kann potenzielle Ein- und Ausstiegspunkte signalisieren.
- Divergenz: Wenn der Kurs ein neues Hoch oder Tief erreicht, der TSI dies jedoch nicht tut, kann dies auf eine potenzielle Trendwende hinweisen.
- Überkaufte/überverkaufte Zustände: Er kann helfen zu erkennen, wann ein Vermögenswert möglicherweise überkauft oder überverkauft ist, wobei die spezifischen überkauften und überverkauften Niveaus je nach Volatilität des Vermögenswerts variieren können.
Zusammenfassung
Kundenbewertungen
5 | 0 % | |
4 | 100 % | |
3 | 0 % | |
2 | 0 % | |
1 | 0 % |


![„[Hamster-Coder] Pivot Points MTF“-Logo](https://cdn.ctrader.com/image/webp/4c143e5a-309c-40e3-a578-f04d1e133ffa_31159)


