
Описание
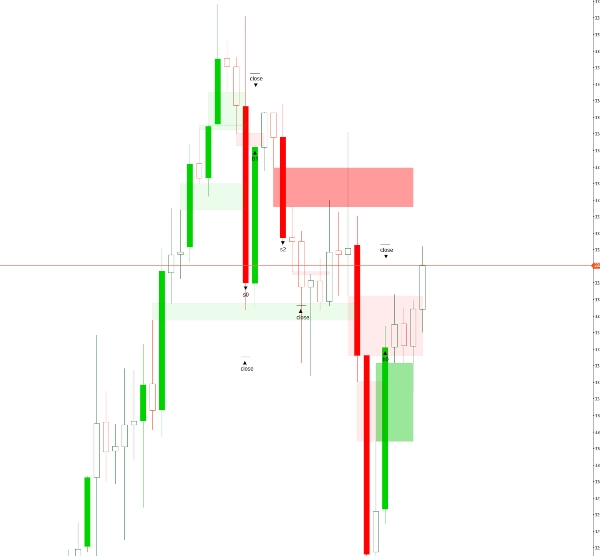
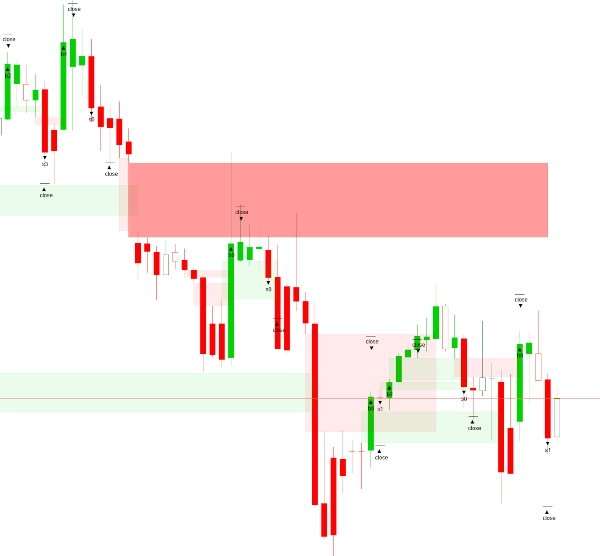
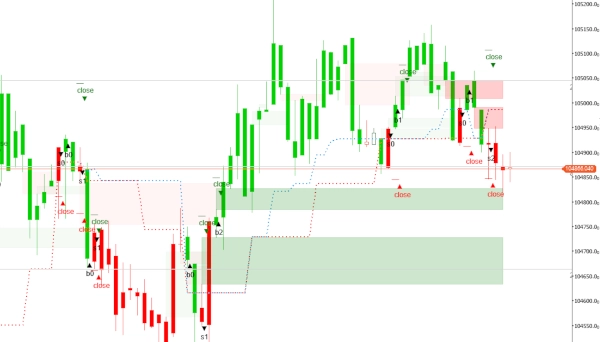
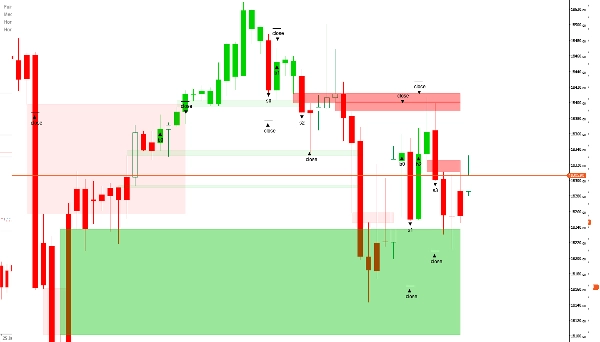
Этот индикатор Fair Value Gap (FVG) является инструментом технического анализа, предназначенным для выявления ценовых неэффективностей на финансовых рынках. Он определяет области, где цена резко выросла или упала, оставляя «пробел» — зону с минимальной или отсутствующей торговой активностью. Эти пробелы часто сигнализируют о временном дисбалансе спроса и предложения, предполагая, что цена со временем может вернуться, чтобы «заполнить» пустоту, поскольку рынок стремится к равновесию. Обычно FVG распознается, когда свеча закрывается значительно выше максимума или ниже минимума предыдущей свечи без перекрытия, указывая на потенциальную область реакции. Такое поведение часто связано с институциональной торговлей или алгоритмической активностью. В то время как большинство версий этого индикатора анализируют дисбалансы на одном таймфрейме, премиум-версия добавляет универсальность, обнаруживая и отображая пробелы с более высоких или низких таймфреймов непосредственно на текущем графике, обеспечивая более глубокий контекст для анализа на нескольких таймфреймах.
Обзор настроек
- Количество загружаемых баров: Указывает количество исторических баров для анализа, начиная с самого последнего завершенного и двигаясь назад.
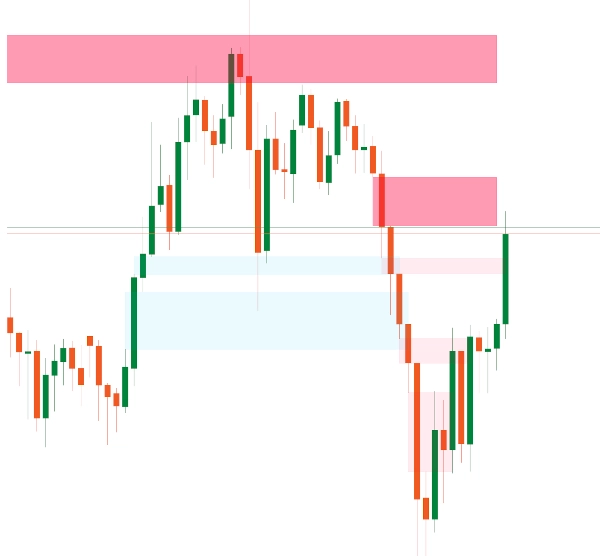
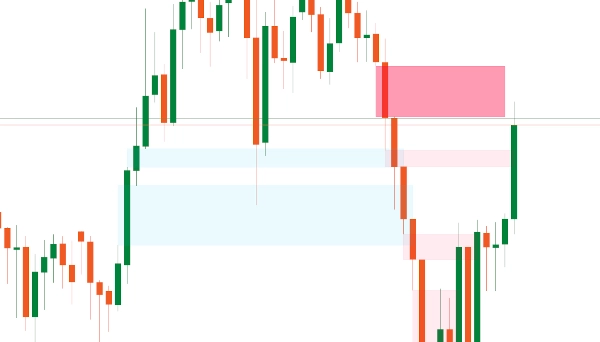
- Цвет бычьего FVG: Устанавливает цвет для FVG, появляющихся в восходящем тренде. Применяется 30% прозрачность, чтобы элементы за пробелом оставались видимыми.
- Цвет медвежьего FVG: Устанавливает цвет для FVG, появляющихся в нисходящем тренде, также с 30% прозрачностью для лучшей видимости на графике.
Премиум-функции (доступны в платной версии)
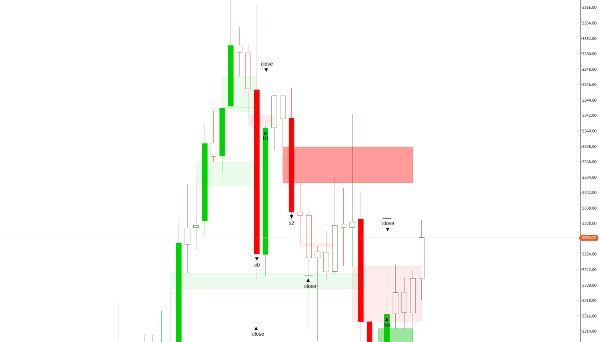
- Удалять закрытые пробелы: Булевый параметр — при включении («yes») автоматически удаляет все закрытые пробелы; если отключен («no»), пробелы остаются видимыми. Особенно полезно на низких таймфреймах (меньше 20 минут).
- Редактировать/удалять пробелы: Позволяет трейдерам вручную корректировать или удалять пробелы. Это дает опытным трейдерам больший контроль, особенно учитывая, что очень маленькие пробелы обычно мало влияют на движение цены.
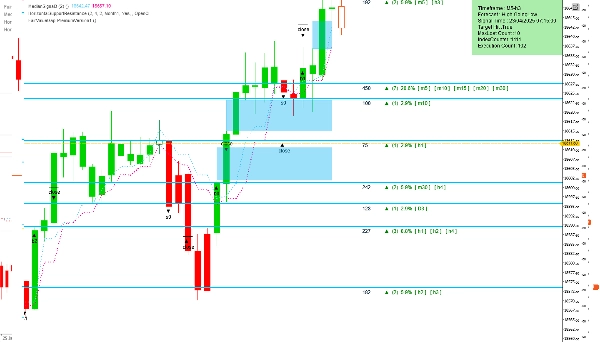
- Выбор таймфрейма: Предлагает два варианта — использовать таймфрейм текущего графика или выбрать другой для анализа, при этом результаты отображаются на основном графике. Эта функция помогает трейдерам быстрее получать информацию о вероятных движениях рынка.
- Выбранный таймфрейм: Указывает желаемый таймфрейм для анализа, если в настройках выше выбран «Выбранный таймфрейм».
- Точность маленьких пробелов: Позволяет трейдерам ввести предпочитаемый размер пробела в виде целого числа, помогая выявлять пробелы, которые исторически приводят к благоприятным результатам. Значение основано на всем наборе данных и размерах пробелов, наблюдаемых для актива.
По умолчанию индикатор сканирует все дисбалансы в рамках одного таймфрейма. Однако доступ к премиум-функциям через FairValueGapPremium версию может значительно расширить аналитические возможности.
Сводка
This indicator detects such gaps to highlight potential reaction zones. By default, it analyzes imbalances within a single timeframe. The premium version enhances functionality by allowing detection and display of FVGs from higher or lower timeframes directly on the current chart, supporting multi-timeframe analysis.
Key settings include the number of historical bars to analyze and customizable colors for bullish and bearish gaps with transparency for chart clarity. Premium features offer options to automatically delete closed gaps, manually edit or remove gaps, select analysis timeframes independent of the chart’s timeframe, and specify gap size accuracy to focus on significant gaps.
This tool aids traders in identifying price inefficiencies and probable market reaction areas through detailed gap analysis across multiple timeframes.
Отзывы покупателей
5 | 100 % | |
4 | 0 % | |
3 | 0 % | |
2 | 0 % | |
1 | 0 % |


