
Описание
Этот индикатор Bar Sentiments Chart является инструментом технического анализа, который измеряет силу и направление рыночного настроения на основе каждого бара (или свечи). Он исследует взаимосвязь между ценами открытия, максимума, минимума и закрытия каждого бара, чтобы определить, проявлял ли рынок бычье, медвежье или нейтральное поведение в этот период времени.
Обычно бычье настроение определяется, когда цена закрытия значительно выше цены открытия, что указывает на сильное давление покупателей. Медвежье настроение фиксируется, когда цена закрытия заметно ниже цены открытия, сигнализируя о сильном давлении продавцов. Нейтральные бары, часто называемые "доджи", отражают нерешительность или равновесие между покупателями и продавцами.
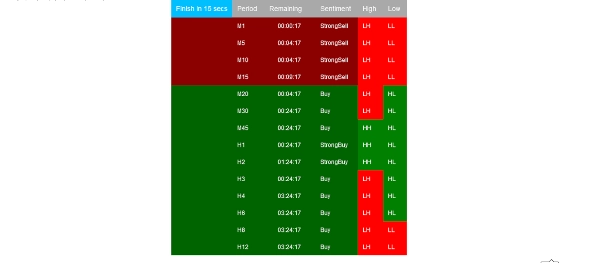
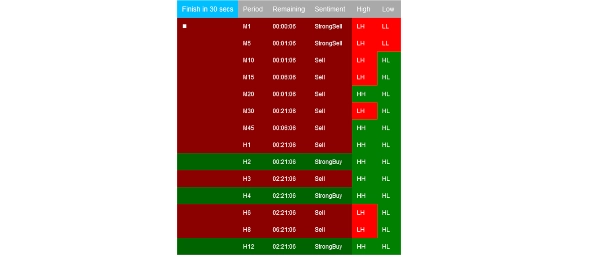
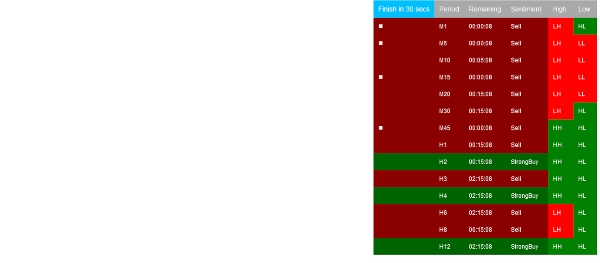
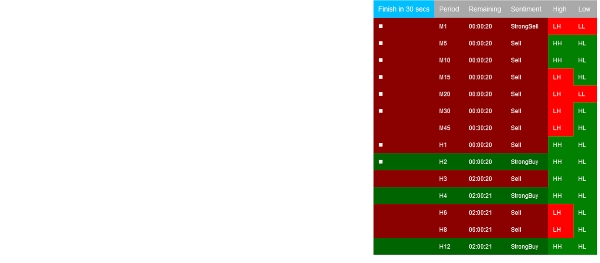
Продвинутые версии индикатора Bar Sentiments могут включать дополнительные элементы, такие как объем, относительный размер тела или моментум, чтобы уточнить классификацию настроений. Настроения часто визуализируются с помощью цветовой кодировки — зеленый для бычьего, красный для медвежьего и серый или синий для нейтрального — что облегчает быстрое оценивание преобладающего рыночного тона.
Если 1 и 0 являются строительными блоками программной инженерии, то вывод индикатора Bar Sentiments Chart представляет собой фундаментальные строительные блоки продвинутых торговых систем машинного обучения. Количественно оценивая исходное рыночное настроение, он предоставляет важные входные данные для алгоритмов, которые стремятся изучать и прогнозировать будущие движения цен на основе исторического поведения.
Используя индикатор Bar Sentiments Chart, трейдеры получают более глубокое понимание микроэкономической динамики рынка, что помогает им выявлять силу тренда, потенциальные развороты и периоды консолидации — особенно в сочетании с анализом на нескольких таймфреймах и другими техническими инструментами.
Сводка
Advanced versions may integrate factors like volume, relative body size, or momentum to enhance sentiment accuracy. The indicator typically uses color-coding—green for bullish, red for bearish, and gray or blue for neutral—to visually represent market tone. By quantifying raw market sentiment, it provides foundational data useful for machine learning trading systems aiming to predict future price movements.
Traders can use this indicator to gain insight into micro market dynamics, helping to identify trend strength, potential reversals, and consolidation phases. It is particularly effective when combined with multi-timeframe analysis and other technical tools.
Отзывы покупателей
5 | 100 % | |
4 | 0 % | |
3 | 0 % | |
2 | 0 % | |
1 | 0 % |


