
Описание
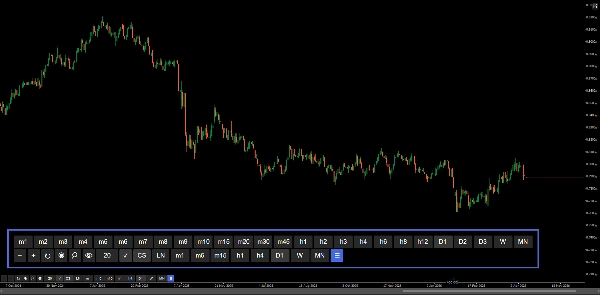
Панель управления графиком для более быстрой навигации — масштабирование, временные интервалы и настройка графика без выхода из графика.
Предустановки масштабирования, ручной ввод масштаба, полный выбор временных интервалов и графиков, настраиваемые избранные временные интервалы, разделители периодов, сетка с круглыми числами и линии живых заявок на покупку/продажу — всё доступно через кнопки интерфейса на графике. Разработано для сокращения времени навигации по стандартным меню cTrader во время активных торговых сессий.
ОСОБЕННОСТИ
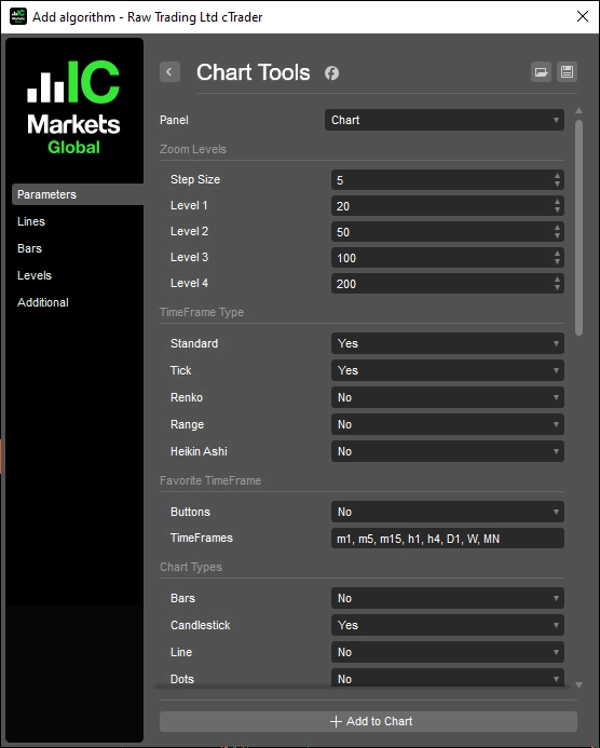
Управление масштабом
- Увеличение / уменьшение масштаба с настраиваемым шагом
- Четыре настраиваемых предустановленных уровня масштабирования для быстрого доступа
- Ручной ввод масштаба с кнопкой применения
- Синхронизация с нативными событиями масштабирования cTrader
Выбор временного интервала
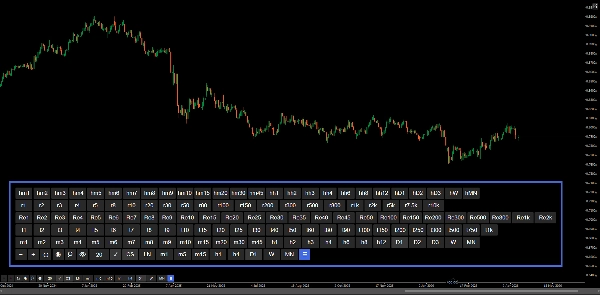
- Полная панель кнопок, охватывающая все типы временных интервалов: стандартные, Heikin Ashi, Renko, Range, Tick
- Режим "Все" отображает каждый тип отдельными строками
- Активный временной интервал выделяется автоматически
- Переключение видимости панели кнопкой ☰
Избранные временные интервалы
- Настраиваемая строка быстрого доступа через ввод через запятую (например, m1, h1, D1)
- Поддержка всех типов временных интервалов, включая Range и Tick
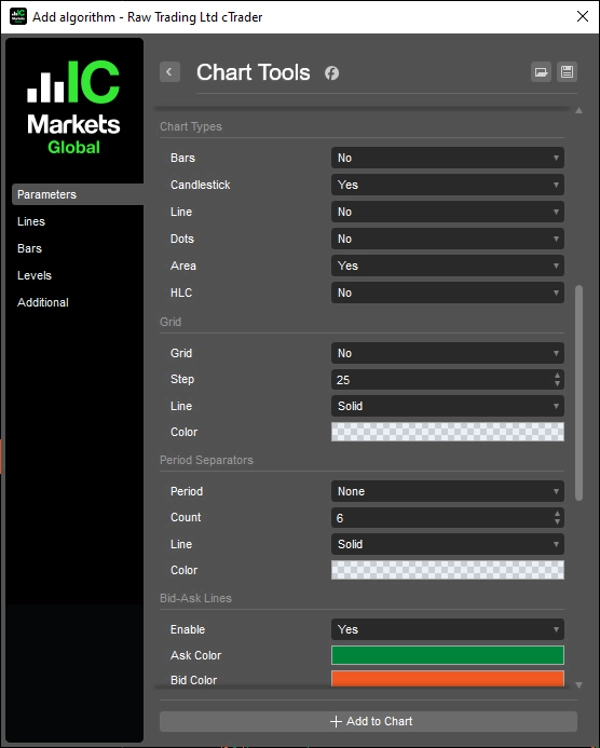
Тип графика
- Кнопки быстрого переключения для: Bars, Candlestick, Line, Dots, Area, HLC
- Активный тип графика выделяется автоматически
- Каждая кнопка настраивается индивидуально через параметры
Сетка
- Сетка на основе круглых чисел с настраиваемым интервалом в пипах (множитель)
- Ценовые метки с умным форматированием десятичных знаков
- Линии продолжаются на 10 баров за последний бар
- Переключатель включения/отключения
Разделители периодов
- Разделители: дневные, недельные, месячные и годовые
- Настраиваемое количество, цвет, стиль линии и толщина
- Автоматическое обновление при прокрутке и масштабировании
Линии Bid/Ask
- Линии живых заявок на покупку и продажу, продолжающиеся до бесконечности
- Настраиваемые цвета для ask и bid
- Переключатель включения/отключения
Кнопки
- Позиция: верхний правый, верхний левый, нижний правый, нижний левый
- Настраиваемые отступы
- Настраиваемые цвета кнопок и текста — включая активное состояние, применение масштаба и кнопку переключения графика
__________________________________________________________________________________________
БОЛЬШЕ БЕСПЛАТНЫХ ИНДИКАТОРОВ
Изучите широкий спектр инструментов анализа рынка — от структуры и объема до регрессии, волатильности и пользовательских временных интервалов.
Исходный код доступен в репозитории на GitHub repository.
Все бесплатно для использования. Но если хотите поддержать проект чашечкой кофе, можете сделать это здесь.
Поддержка/Сопротивление
Объем
- Volume Activity Profiler
- Volume Efficiency Analyzer
- Volume Profile Analytics
- Volume Profile - Updated
- Volume Spread Analysis
- VWAP (Volume Weighted Average Price)
Скользящие средние
- SSL Channel
- Anchored Moving Average
- Deviation-Scaled Moving Average
- Gann High Low Activator
- Instantaneous Trendline
- Kaufman Adaptive MA with Trend Vision
- Moving Average Channel
- Moving Averages Suite
- Trend Channel Moving Average
Утилиты/Пользовательские
Регрессия
Волатильность
Осцилляторы
__________________________________________________________________________________________
ОТКАЗ ОТ ОТВЕТСТВЕННОСТИ
Торговля связана с риском. Этот индикатор предназначен только для технического анализа — всегда применяйте надлежащее управление рисками и торгуйте ответственно.
ОБРАТНАЯ СВЯЗЬ И УЛУЧШЕНИЯ
Если у вас есть предложения, запросы на функции или идеи по улучшению, пожалуйста, оставьте комментарий во вкладке Обсуждение. Ваш отзыв помогает улучшить индикатор для всех.
Сводка
Users can configure a quick-access row of favorite timeframes supporting all timeframe types. The chart type switcher offers quick buttons for Bars, Candlestick, Line, Dots, Area, and HLC charts, each with individual configuration and automatic active state highlighting.
Additional features include a round numbers-based grid with configurable pip intervals and smart decimal formatting, daily to yearly period separators with customizable appearance, and live bid/ask lines extending indefinitely with color customization and toggle options.
The control panel’s buttons can be positioned in any corner of the chart with configurable margins and colors, including active states and zoom application. This tool aims to streamline active trading sessions by reducing time spent navigating native menus, supporting efficient technical analysis on various chart types and timeframes.
Отзывы покупателей
5 | 100 % | |
4 | 0 % | |
3 | 0 % | |
2 | 0 % | |
1 | 0 % |


