
说明
使用五种专业枢轴方法计算任意时间框架的支撑和阻力位。
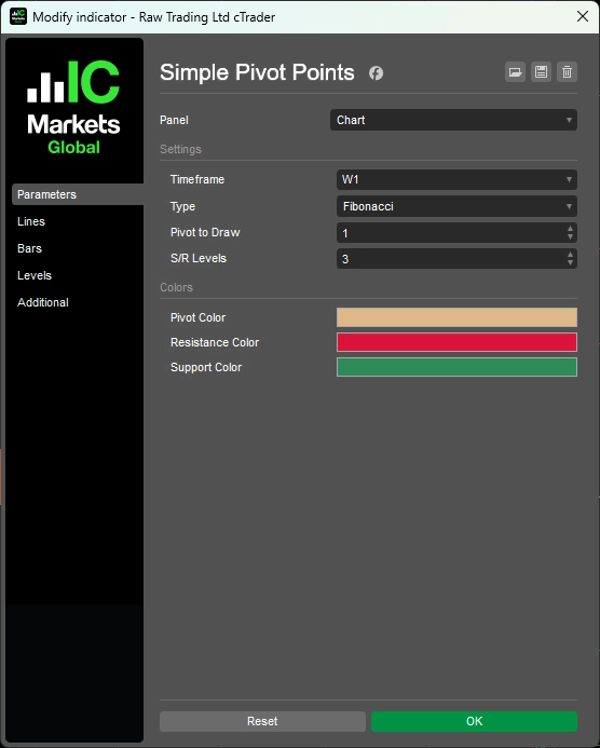
自动生成从M5到月度数据的枢轴水平(标准、斐波那契、伍迪、卡玛里拉、德马克),并为每个周期提供时间限制显示。
五种计算算法具有不同的支撑/阻力间距逻辑,可配置的支撑/阻力级别(每侧0-6个),多个历史周期的枢轴显示,自动标记线(PP,R1-R6,S1-S6),以及颜色编码的可视化,为交易者提供机构级的枢轴分析,帮助锁定关键价格水平和日内反转。
功能特点
五种计算方法
- 标准:经典的场内交易员公式——全球最广泛关注的枢轴点
- 斐波那契:使用斐波那契比率(38.2%,61.8%,100%,138.2%,161.8%)进行支撑/阻力间距计算
- 伍迪:对收盘价赋予较大权重——对近期价格动作反应更灵敏
- 卡玛里拉:使用1.1/12倍数的紧密日内水平——受欢迎的剥头皮工具
- 德马克:基于收盘价与开盘价关系的条件公式——仅有1个支撑/阻力级别但备受尊重
完全自定义
- 任意时间框架:支持从M5、H1、H4、日线、周线、月线数据计算
- 历史枢轴:显示多个前期(例如,最近3周的枢轴)
- 可配置级别:每侧显示0-6个支撑/阻力级别
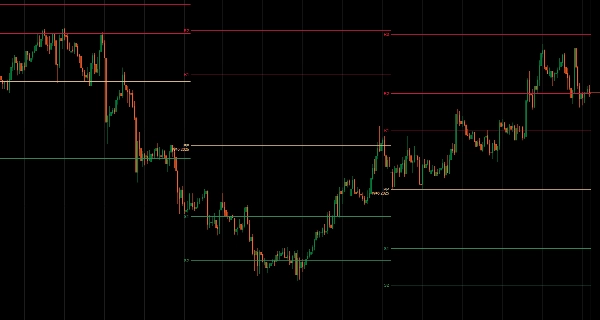
- 自动标记线:清晰标注PP,R1-R6,S1-S6
- 时间限制线:每个周期的枢轴仅在该周期内显示
- 颜色编码:枢轴(棕褐色)、阻力(红色)、支撑(绿色)
__________________________________________________________________________________________
更多免费指标
探索广泛的市场分析工具——从结构和成交量到回归、波动率和自定义时间框架。
源代码可在GitHub 仓库获取。
所有工具均免费使用。但如果您愿意支持咖啡费用,可以通过 这里捐助。
支撑/阻力
成交量
移动平均线
工具/自定义
基于回归
波动率
振荡器
__________________________________________________________________________________________
免责声明
交易存在风险。此指标仅用于技术分析——请始终应用适当的风险管理并负责任地交易。
反馈与改进
如果您有建议、功能请求或改进想法,请在讨论标签页留言。您的反馈有助于为所有人改进该指标。
摘要
AI 摘要
Simple Pivot Points is a technical analysis indicator that calculates key support and resistance levels using five professional pivot point methods: Standard, Fibonacci, Woodie, Camarilla, and DeMark. It supports any timeframe from 5 minutes up to monthly data, automatically generating pivot levels with time-bound display for each period. Users can customize the number of support and resistance levels (0 to 6 per side), view historical pivots for multiple previous periods, and benefit from auto-labeled lines (PP, R1-R6, S1-S6) with color-coded visualization (pivot in tan, resistance in red, support in green). Each calculation method applies a distinct spacing logic, such as classic floor trader formulas, Fibonacci ratios, close-price weighting, intraday scalping levels, or conditional formulas based on price relationships. This indicator provides institutional-grade pivot analysis to assist traders in identifying key price levels and potential intraday reversals.
指标配置
客户评价
5.0
评价:1
5 | 100 % | |
4 | 0 % | |
3 | 0 % | |
2 | 0 % | |
1 | 0 % |
客户评价
December 1, 2025
This Pivot Point indicator works flawlessly on cTrader. The levels are accurate, the visuals are clean, and customization is very easy. It updates smoothly across timeframes and provides reliable support/resistance zones for planning trades. Simple, effective, and highly recommended.
讨论
常见问答
Fibonacci
cTrader Store 提供的所有产品,包括交易机器人、指标和插件,均由第三方开发者提供,仅供信息参考和技术访问之用。cTrader Store 并非经纪商,不提供投资建议、个人推荐或任何未来业绩保证。


价格
注册日期 20/12/2024
8.07K
免费安装