
Fixed Range Volume Profile
Chỉ báo
2 lượt mua
Phiên bản 1.0, Jan 2026
Windows, Mac
4.0
Đánh giá: 2
Mô tả
Cách Sử Dụng Hồ Sơ Khối Lượng Phạm Vi Cố Định (FRVP)
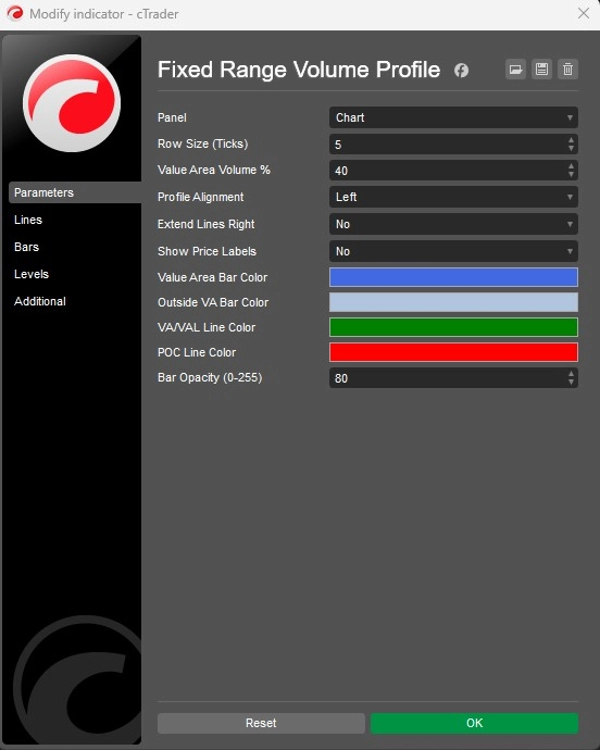
- Kích Hoạt Chỉ Báo: Kéo và thả Chỉ Báo FRVP lên biểu đồ bạn muốn từ menu cTrader Automate hoặc Indicators.
- Chọn Công Cụ Phân Tích: Tìm công cụ Vẽ Hình Chữ Nhật tiêu chuẩn trong thanh công cụ cTrader (thường ở bên phải hoặc bên trái của nền tảng).
- Xác Định Phạm Vi Của Bạn: Nhấp và kéo hình chữ nhật lên hành động giá và khoảng thời gian cụ thể bạn muốn phân tích.
- Khởi Tạo Hồ Sơ: Sau khi vẽ, nhấp và đẩy nhẹ hình chữ nhật. "Cái bắt tay" giữa hình vẽ và chỉ báo này kích hoạt việc tính toán khối lượng, ngay lập tức tạo ra biểu đồ cột, POC và các đường Khu Vực Giá Trị.
- Điều Chỉnh Linh Hoạt: Bạn có thể kéo các cạnh của hình chữ nhật để mở rộng phạm vi thời gian hoặc di chuyển nó đến một mức giá khác; hồ sơ khối lượng sẽ tự động tính toán lại để phản ánh khu vực mới.
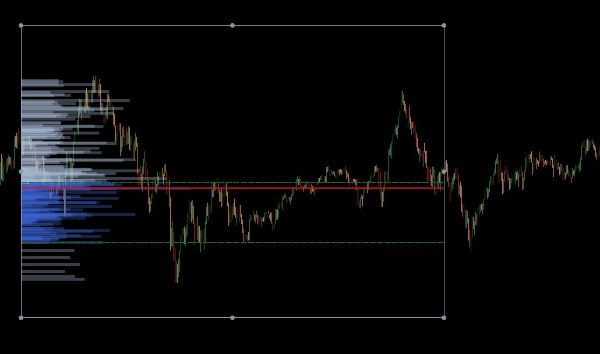
Hồ Sơ Khối Lượng Phạm Vi Cố Định (FRVP) cho cTrader là một công cụ phân tích tinh vi được thiết kế để xác định các mức giá quan trọng bằng cách tính toán phân bố khối lượng trong một phạm vi thời gian và giá cụ thể. Khác với các chỉ báo khối lượng tiêu chuẩn dựa trên thời gian, chỉ báo này tập trung vào mật độ giá để tiết lộ tâm lý thị trường.
Các Tính Năng Chính
- Chọn Phạm Vi Động: Chỉ báo tự động tính toán và cập nhật mỗi khi bạn vẽ hoặc di chuyển một hình chữ nhật tiêu chuẩn trên biểu đồ cTrader của bạn.
- Xác Định Mức Quan Trọng:
-
- Điểm Kiểm Soát (POC): Làm nổi bật mức giá có khối lượng giao dịch cao nhất, đóng vai trò như một "nam châm" cho hành động giá.
- Giá Trị Khu Vực Cao/Thấp (VAH/VAL): Xác định ranh giới nơi một tỷ lệ phần trăm khối lượng cụ thể (mặc định 40%) đã được giao dịch.
- Bố Cục Tùy Chỉnh:
-
- Căn Chỉnh: Chọn hiển thị biểu đồ khối lượng từ phía Trái hoặc Phải của hộp.
- Độ Chi Tiết: Điều chỉnh Kích Thước Hàng (mặc định 5 ticks) để kiểm soát chi tiết của các thanh khối lượng.
- Hình Ảnh: Toàn quyền kiểm soát màu sắc thanh (Khu Vực Giá Trị so với Bên Ngoài), độ mờ và hiển thị nhãn giá.
Ứng Dụng Chiến Lược
- Hỗ Trợ & Kháng Cự: Các Nút Khối Lượng Cao (HVN) thường đóng vai trò là hỗ trợ hoặc kháng cự mạnh, trong khi Các Nút Khối Lượng Thấp (LVN) đại diện cho các khu vực "mỏng" nơi giá có thể di chuyển nhanh.
- Xác Nhận Xu Hướng: Sử dụng tính năng Mở Rộng Sang Phải để xem cách các mức khối lượng lịch sử tương tác với hành động giá hiện tại khi nó phát triển.
Tóm tắt
Tóm tắt AI
The Fixed Range Volume Profile (FRVP) indicator for cTrader analyzes volume distribution within a user-defined price and time range using a standard rectangle drawing tool. By selecting and adjusting this rectangle on the chart, the indicator dynamically calculates and displays a volume histogram along with key levels: Point of Control (POC), which marks the price with the highest traded volume, and Value Area High/Low (VAH/VAL), defining the volume concentration boundaries. Users can customize the histogram’s alignment, granularity (row size), colors, opacity, and price label visibility. The indicator supports dynamic range adjustments by dragging the rectangle edges, automatically recalculating volume data. Strategically, it helps identify support and resistance zones through high and low volume nodes and offers trend confirmation by extending volume levels into current price action. The FRVP is applicable across various markets including Forex, cryptocurrencies, commodities, indices, and stocks, and supports symbols such as BTCUSD, EURUSD, GBPUSD, XAUUSD, and NAS100. It integrates with cTrader’s drawing tools and provides a detailed volume-based perspective on price action beyond standard time-based volume indicators.
Hồ sơ chỉ báo
Đánh giá của khách hàng
4.0
Đánh giá: 2
5 | 0 % | |
4 | 100 % | |
3 | 0 % | |
2 | 0 % | |
1 | 0 % |
Thảo luận
Câu hỏi thường gặp
BTCUSD
Forex
Signal
Breakout
Indices
EURUSD
Commodities
GBPUSD
NZDUSD
Fibonacci
Prop
Scalping
Fair Value Gap
SMC
Crypto
Stocks
XAUUSD
NAS100
USDJPY
VWAP
Các sản phẩm có sẵn trên cTrader Store, bao gồm bot giao dịch, chỉ báo và plugin, được cung cấp bởi các nhà phát triển bên thứ ba và chỉ nhằm mục đích cung cấp thông tin và tiếp cận kỹ thuật. cTrader Store không phải là nhà môi giới và không cung cấp lời khuyên đầu tư, khuyến nghị cá nhân hay bất kỳ đảm bảo nào về hiệu suất trong tương lai.


Giá
Kể từ 26/09/2025
14
Lượt bán