"VWAP (Volume Weighted Average Price)" 标识
指标
1.11K 下载
版本 1.0, Nov 2025
Windows 版、Mac 版
5.0
评价:1
"VWAP (Volume Weighted Average Price)" 已上传图片
注册日期 20/12/2024
6.95K
免费安装

重要提示 - 请先阅读


外汇成交量不是实际成交量

外汇中的成交量是“tick”成交量——它计算价格变化的次数。它不计算交易了多少钱。


Tick成交量无法显示的内容

  • 交易规模。100美元的交易和1,000万美元的交易都计为1个tick。
  • 真实资金流。你无法看到是大资金还是小资金推动了价格。
  • 真实流动性。你无法看到市场中有多少订单在等待。
  • 银行活动。银行可以看到真实的成交量数据,而你看不到。


这意味着什么

Tick成交量只显示价格变化的频率——而非背后的资金量。这带来了以下问题:

  • 你无法追踪银行或机构。他们使用你无法访问的真实成交量数据。
  • 你无法验证“聪明资金”理论。这些理论需要真实成交量,而非tick计数。
  • 你无法判断真实流动性。Tick活动不显示订单深度或真实市场强度。
  • 你无法衡量真实的买卖力量。许多小额交易看起来和一笔大型机构交易一样。
  • 成交量激增可能是误导。激增可能只是算法噪音,而非真实交易兴趣。


如何正确使用此指标

  • 将其视为活动计量器,而非资金计量器。高tick成交量=市场活跃。低tick成交量=市场安静,仅此而已。
  • 比较不同时间的活动。用它来观察:伦敦时段是否比纽约更忙?今天是否比昨天更活跃?趋势期是否比盘整期更忙?
  • 结合价格结构使用。结合支撑/阻力、摆动点或BOS/ChoCH与成交量。价格背景可以防止噪音成交量激增带来的假信号。
  • 关注重要价格水平的活动。当价格测试关键水平且tick成交量增加时,意味着更多交易者活跃。但这不代表大玩家参与。
  • 不要假设它显示机构活动。Tick成交量无法显示积累、大额订单或“聪明资金”。仅用它来衡量节奏和速度。


__________________________________________________________________________________________


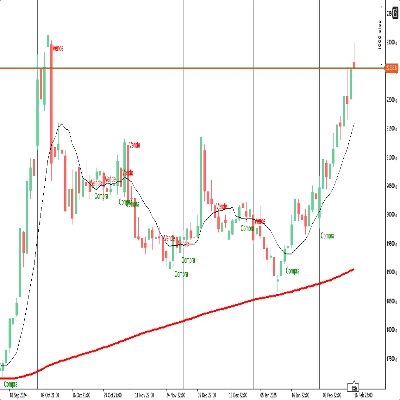
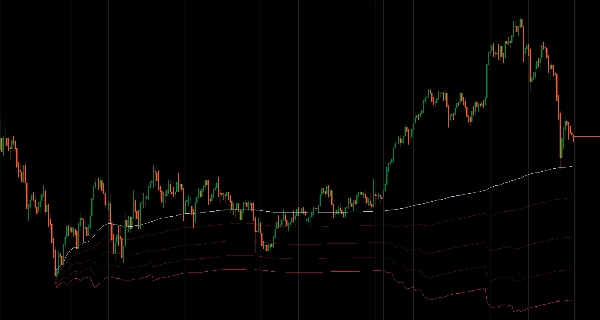
带有灵活重置周期和三种带计算方法的成交量加权平均价。


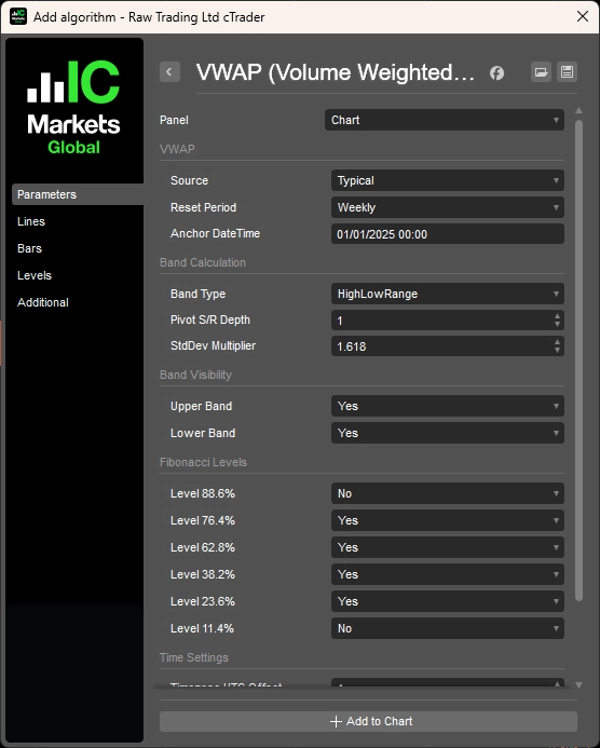
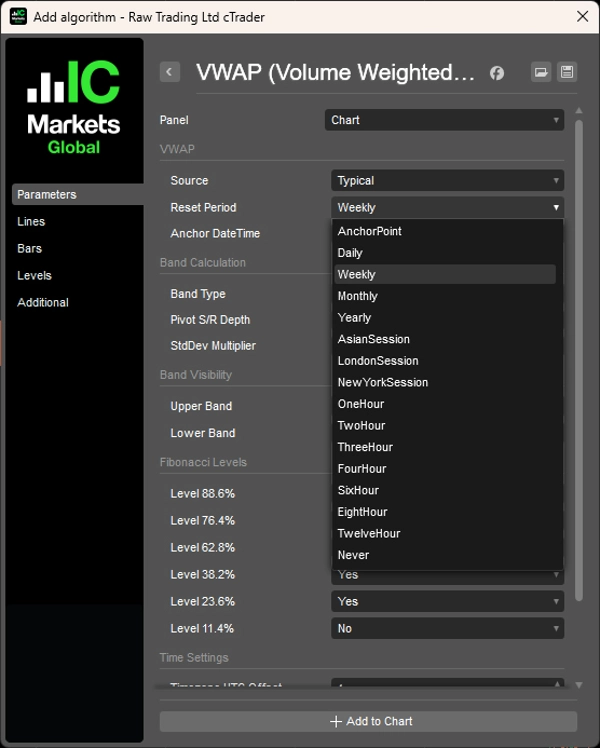
计算成交量加权平均价,支持灵活的重置周期,包括基于时间的间隔(日、周、月、年或自定义小时)、基于交易时段的重置(亚洲、伦敦、纽约,起始时间可配置)、锚点模式用于将VWAP固定到特定事件,或从所有可用数据滚动计算。

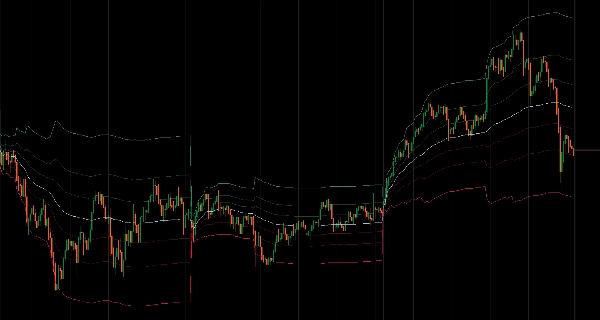
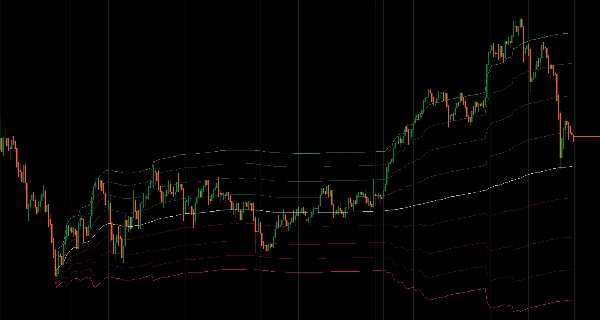
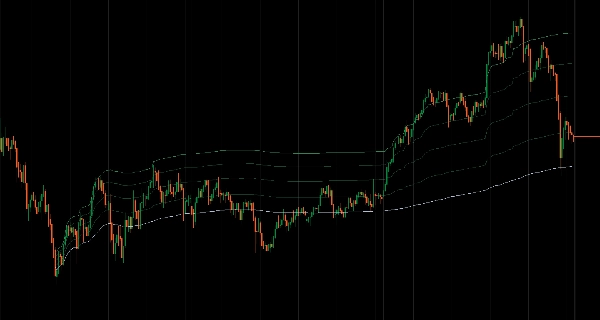
提供三种带计算方法:基于前一周期价格区间的高低范围带,使用经典枢轴点计算的斐波那契枢轴带,以及随波动性扩展和收缩的标准差带。

您可以自定义八个斐波那契级别(100%、88.6%、76.4%、62.8%、50%、38.2%、23.6%、11.4%、0%),支持单独可见性切换和快速上下带组控制。交易时段管理包括精确的起始时间配置,带UTC偏移调整和时区感知的小时重置处理。


功能特点


  • 灵活的重置周期
    • 基于时间:每日、每周、每月、每年或自定义小时间隔(1H、2H、3H、4H、6H、8H、12H)
    • 基于交易时段:亚洲、伦敦、纽约时段,起始时间和时区偏移可配置
    • 锚点模式:将VWAP固定到任何特定日期时间以进行事件驱动分析
    • 滚动计算:从所有可用数据计算,无需重置
  • 三种带计算方法
    • 高低范围:基于前一周期价格区间的带
    • 斐波那契枢轴:基于前一周期高/低/收的经典枢轴点计算
    • 标准差:随波动性扩展和收缩的传统统计带
  • 完整的斐波那契级别控制
    • 8个可自定义级别:100%、88.6%、76.4%、62.8%、50%(VWAP)、38.2%、23.6%、11.4%、0%
    • 单独级别可见性切换
    • 上下带组快速调整控制
  • 交易时段管理
    • 配置精确的交易时段起始时间,支持UTC偏移调整(-12至+14小时)
    • 可视化交易时段信息显示当前重置计划
    • 支持时区感知的小时重置处理
  • 性能优化
    • 惰性计算——仅在带可见时计算
    • 智能缓存和批处理
    • 即使启用所有级别,CPU影响也极小


__________________________________________________________________________________________


更多免费指标


探索各种市场分析工具——从结构和成交量到回归、波动率和自定义时间框架。

源代码可在GitHub 仓库获取。

全部免费使用。但如果您愿意支持咖啡费用,可以通过 这里捐赠。


支撑/阻力


成交量


移动平均线


工具/自定义


基于回归


波动率


振荡器


__________________________________________________________________________________________


免责声明

交易存在风险。此指标仅用于技术分析——请始终应用适当的风险管理并负责任地交易。


反馈与改进

如果您有建议、功能请求或改进想法,请在讨论标签页留言。您的反馈有助于为所有人改进此指标。

指标配置
5.0
评价:1
5
100 %
4
0 %
3
0 %
2
0 %
1
0 %
客户评价
April 29, 2026
Incredible for Day Trading! I use this VWAP indicator daily to find my entries and exits. It helps me stay on the right side of the institutional flow. The visual lines are crisp, and the anchor settings are very flexible. If you trade based on volume and price action, this is an essential addition to your cTrader workspace.
VWAP
cTrader Store 提供的所有产品,包括交易机器人、指标和插件,均由第三方开发者提供,仅供信息参考和技术访问之用。cTrader Store 并非经纪商,不提供投资建议、个人推荐或任何未来业绩保证。

该作者的其他作品

指标
Fibonacci
Fair Value Gap
Detect FVGs with age, status, Fibonacci levels, and customizable fill threshold—extended version.
指标
Fibonacci
Clear pivot levels. Clean S/R zones. Five methods. Any timeframe.
指标
Forex
Crypto
+3
Volume distribution analysis with Market Profile TPO integration.
指标
Forex
Crypto
+3
Custom and native timeframes display with OHLC lines, moving averages, and Fibonacci levels.
指标
Forex
Crypto
+3
VSA indicator analyzing volume, spread, and close location to detect supply/demand imbalances.
指标
Breakout
Fibonacci
Track Initial Balance ranges across any period with optional Fibonacci levels and projections.
指标
Forex
Crypto
+3
28-method MA library in one indicator — from classic EMAs to adaptive & zero-lag variants.
指标
Breakout
Plots automatic psychological levels at round-number zones – major structure & liquidity levels.
指标
Breakout
Fibonacci
Statistically-grounded trend channels via linear regression — clear trend & reversal zones.
指标
Forex
Crypto
+3
John Ehlers' trendline using signal processing to filter cycle noise and identify trends with minimal lag.
指标
Forex
Crypto
+3
Volume profiler applying Wyckoff effort vs result and spread analysis with visual bar graphs.
指标
Bollinger
Complete MA-channel system: colored trend, channel boundaries & equilibrium with 6 Fib zones.

猜您喜欢

指标
Imbalance
Key Levels
+2
A Next-Generation Adaptive Oscillator with Z-Score Regime Engine.
指标
RSI
SMA
+1
TradingView RSI replica for cTrader with dynamic gradients, automatic divergence detection, and alerts.
指标
AI
ATR
+12
The standard Relative Strength Index (RSI), RSI & Signal Cloud, Smart Volatility Filter (ATR), On-Chart Info Dashboard
指标
ATR
Forex
+1
Trade fearlessly: auto-adjusts order blocks, manages risks, and ensures precision. Free for early users.
指标
Key Levels
Market Structure
Economic calendar news directly on the chart.
指标
ATR
Flag
+5
Decision panel with Buy/Sell scores, market bias, setup quality, trading cost and clear trade reasons.
指标
ATR
Prop
+14
Optimize exits with Chandelier Exit! Visualize stop-loss points dynamically for improved trading precision and safety.
指标
Volume
Key Levels
+4
Session & Kill Zone Highlighter - Visual tool for London, NY, Tokyo, Sydney sessions plus ICT Kill Zones.
指标
Signal
USDJPY
See USD demand in one line—Composite OBV fuses six major FX pairs into a clear momentum gauge.
指标
XAUUSD
Commodities
A Fair Value Gap (FVG) indicator that identifies potential price imbalances, potential reversal and continuation zones
指标
Boost your trading with Candlestick Patterns for cTrader – auto-detect key signals for smarter, faster decisions!
指标
Prop
Forex
+12
⚡ ADXVMA Aurora Trend Filter combines ADX trend strength with an adaptive EMA blend ⚡
指标
Signal
Fractal Arrow Buy and Sell Indicator
指标
Prop
Forex
+13
🎯Automatically detects and visualizes classical chart patterns using multi-timeframe swing point analysis.
指标
Grid
Prop
+4
A free institutional-style chart tool that maps key daily liquidity levels in a clean H Capital interface.
指标
ATR
RSI
+16
This trading game allows you to explore and practice investment strategies in a real-time market data environment.
指标
RSI
Minimalist RSI dots with dynamic colors for instant momentum and extreme zone recognition.
指标
The Break of Structure (BoSCHoCh) Indicator is a smart market structure tool designed to help traders easily spot trend.
注册日期 20/12/2024
6.95K
免费安装