
说明
增强版,具有部分填充阈值控制、精确的年龄跟踪和自动斐波那契缺口水平。
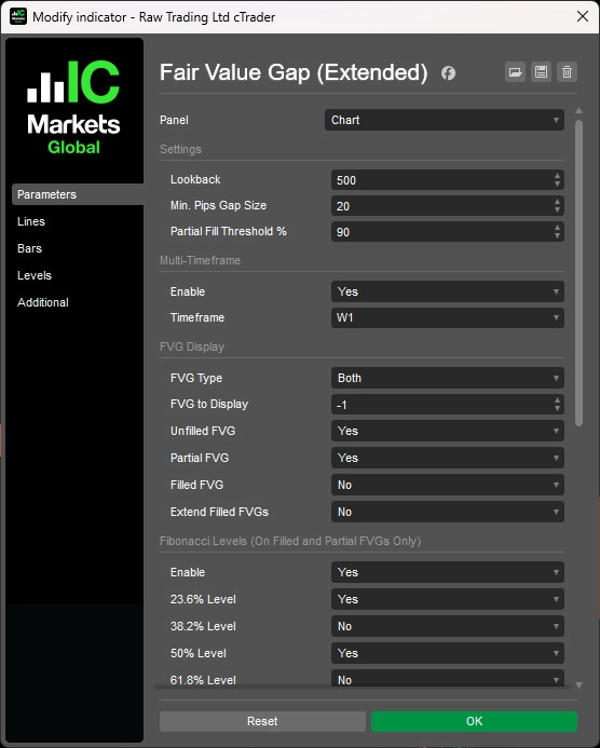
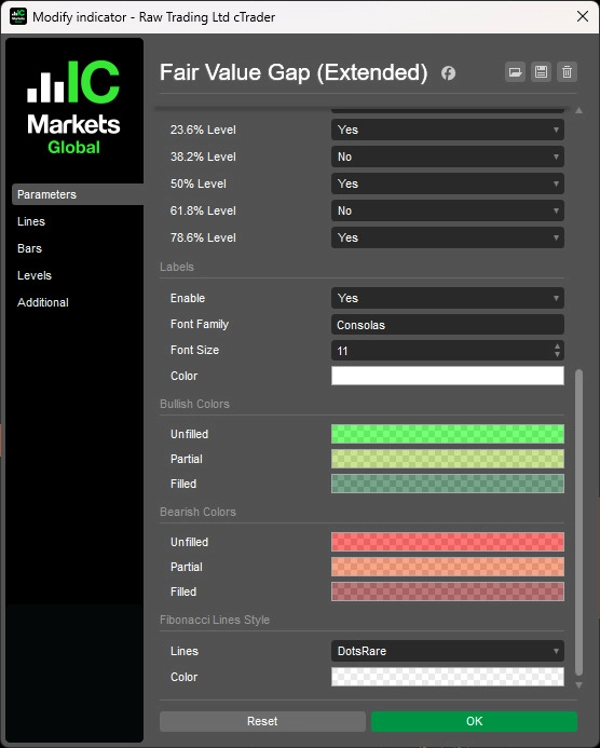
自动检测看涨和看跌缺口,具有可配置的部分填充阈值(50-99%,默认90%),以年/月/周/日格式显示缺口年龄,并在部分和已填充的FVG上投射五个斐波那契水平(23.6%至78.6%)。
多时间框架扫描,将高时间框架结构性缺口与低时间框架价格动作对齐,提供将已填充FVG框扩展到当前柱的选项,无限历史缺口显示(-1设置),动态状态更新(未填充/部分填充/已填充),以及最小且不干扰的标签,为以斐波那契为基础的入场区域目标缺口填充的交易者提供全面的流动性失衡分析。
功能
增强的FVG识别
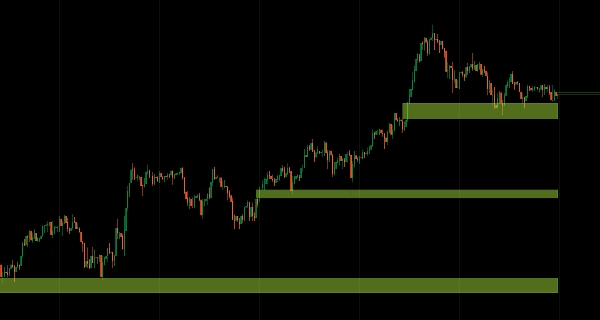
- 自动查找看涨和看跌公平价值缺口
- 实时跟踪未填充、部分填充和完全填充状态
- 部分填充阈值:控制部分填充何时变为完全填充(50-99%,默认90%)
- 干净的视觉绘图,图表杂乱最小化
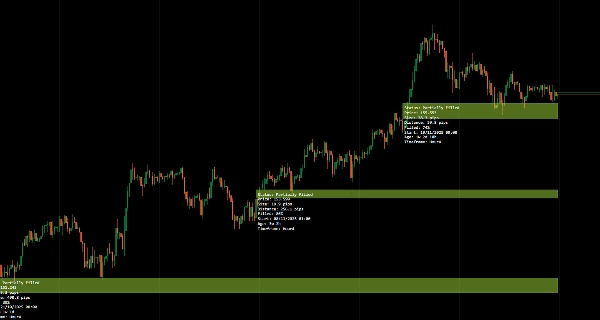
增强的年龄显示
- 以年、月、周和日格式显示精确的缺口年龄(例如,“3年2周4天”)
- 帮助优先考虑新鲜与陈旧缺口以进行交易选择
- 时间上下文改善对缺口相关性的决策
状态跟踪与显示
- 显示当前填充状态:未填充、部分填充或完全填充
- 随着价格与缺口的互动动态更新
- 流动性捕获的视觉确认
- 扩展已填充FVG:可选将已填充FVG框扩展到当前柱以供参考
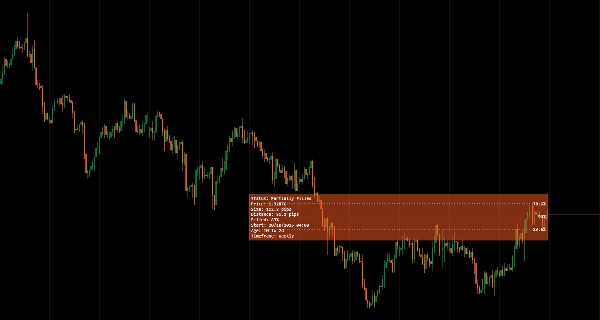
斐波那契水平
- 自动显示部分和已填充FVG上的斐波那契水平(23.6%、38.2%、50%、61.8%、78.6%)
- 无需手动绘制水平线
- 缺口内的精确入场区域
- 简化基于斐波那契的入场策略
多时间框架模式
- 在较低时间框架图表上扫描并显示较高时间框架的FVG
- 将高时间框架结构性缺口与低时间框架价格动作对齐
- 改善多时间框架分析工作流程
显示所有FVG
- 将“显示FVG”设置为-1以无限制显示所有历史FVG
- 全面了解图表上的缺口行为
- 跟踪缺口填充模式随时间的变化
简洁、极简的用户界面
- 设计为清晰的非侵入式标签
- 信息丰富且不干扰价格视图
- 专业呈现,专注分析
__________________________________________________________________________________________
更多免费指标
探索各种市场分析工具——从结构和成交量到回归、波动率和自定义时间框架。
源代码可在GitHub 仓库中获取。
全部免费使用。但如果您愿意支持买杯咖啡,可以通过 这里进行。
支撑/阻力
成交量
移动平均线
实用工具/自定义
基于回归
波动率
振荡器
__________________________________________________________________________________________
免责声明
交易存在风险。此指标仅用于技术分析——请始终应用适当的风险管理并负责任地交易。
反馈与改进
如果您有建议、功能请求或改进想法,请在讨论标签中留言。您的反馈有助于为所有人改进该指标。
摘要
The indicator displays the precise age of each gap in years, months, weeks, and days, aiding traders in prioritizing fresh versus stale gaps. It projects five Fibonacci retracement levels (23.6%, 38.2%, 50%, 61.8%, 78.6%) on partial and filled gaps, providing predefined entry zones based on Fibonacci ratios without manual drawing.
Fair Value Gap (Extended) supports multi-timeframe analysis by scanning higher timeframe gaps and displaying them on lower timeframe charts, facilitating alignment of structural gaps with price action. It offers options to extend filled gap boxes to the current bar and to display unlimited historical gaps for comprehensive gap behavior tracking.
The indicator features a clean, minimal user interface with non-intrusive labels, delivering clear liquidity imbalance insights for traders focusing on gap fills and Fibonacci-based entries.
客户评价
5 | 100 % | |
4 | 0 % | |
3 | 0 % | |
2 | 0 % | |
1 | 0 % |


