
说明
📊 VPOC 蒙特卡洛期望值
https://chartshots.spotware.com/c/69c558e2c68df
综合市场分析:成交量轮廓 + 统计预测 🎯
🎯 它是什么?
VPOC蒙特卡洛期望值是一种量化分析指标,结合了两种专业交易方法:
- 市场深度轮廓(VPOC)- 识别成交量真正集中的位置 🏦
- 蒙特卡洛模拟 - 基于统计概率预测未来情景 📈
结果是一个分析系统,告诉你资金在哪里(控制点)以及资金可能去向何处(预测的期望值)🧠
⚙️ 它如何工作?
模块1:深度轮廓(VPOC)📊
该指标分析最近200根K线(可配置),并将成交量分布在30个价格水平。它计算:
- 控制点(PoC):成交量最高的价格 - 代表买卖双方最活跃的市场共识 ⚖️
- Delta:每个价格水平的买卖压力差异 🔄
- 热力图:活动集中度的可视化 🔥
逻辑:价格倾向于回归到PoC,因为那里是大多数挂单流动性的所在。如果价格远离PoC,回归的概率更高 🔄
模块2:统计预测(蒙特卡洛)🎲
使用随机模拟(默认1000次迭代)来预测未来价格:
- 计算资产的历史趋势和年化波动率 📉📈
- 使用正态分布生成随机路径(几何布朗运动模型)🌊
- 用标准差带(±1西格玛)估计期望值 📏
应用公式: - 每根K线漂移 = 年化收益 / 交易日数 🧮
- 每根K线波动率 = 年化波动率 / √天数 ⚡
- 预测 = 当前价格 × e^(总漂移 + 正态随机 × 总波动率) 🔢
模块3:协同 🔗
结合两种分析生成上下文信号:
表格
信号 条件 含义
看涨 ↑ 🟢 价格 > PoC + 正向预测 成交量确认的看涨趋势
看跌 ↓ 🔴 价格 < PoC + 负向预测 成交量确认的看跌趋势
机会 ★ 💡 价格 < PoC + 正向预测 可能从成交量支撑反弹
背离 ⚠️ ⚠️ 价格 > PoC + 负向预测 可能反转的警告
📈 它的用途是什么?
✅ 识别关键成交量水平 - PoC作为价格磁铁 🧲
✅ 估计成功概率 - 模拟中获胜情景的百分比 🏆
✅ 评估风险/回报 - 预测的夏普比率和标准差 📊
✅ 确认交易方向 - 位置相对于PoC和统计动量的协同 🎯
✅ 目标预测 - 定义持有期的预期价格水平 🎯
🎮 配置和使用
主要参数:
表格
组 参数 默认值 描述
深度轮廓 分析周期 200根K线 用于计算成交量轮廓的历史
价格水平 30 轮廓分辨率(更多水平=更详细)🔍
水平偏移 5 轮廓在图表上的位置 📏
统计预测 最大操作时长 252根K线 预测的时间范围 ⏱️
投资资本 $1,000 货币计算基础 💰
模拟次数 1,000 随机路径数量(越多越准确,但越慢)🔄
无风险利率 5% 用于夏普比率计算 📉
历史策略 使用止盈/止损 否 激活以模拟固定目标 🎯
如何解读结果表:
plain
复制
期望值统计
┌──────────────┬─────────┬─────────┬─────────┬────────┐
│ 方法 │ $金额│ %收益│ 胜率│ 夏普 │
├──────────────┼─────────┼─────────┼─────────┼────────┤
│ 历史 │ -$19.56 │ -1.96% │ 47.2% │ -1.24 │
│ 模拟 │ -$54.05 │ -5.40% │ 21.4% │ -4.95 │
└──────────────┴─────────┴─────────┴─────────┴────────┘
- 历史:类似过去交易的平均表现 📜
- 模拟:1000次蒙特卡洛模拟的平均结果 🎲
- 胜率:正向结果情景的百分比 ✅
- 夏普:风险调整后的收益(大于1为好,负值为差)📈
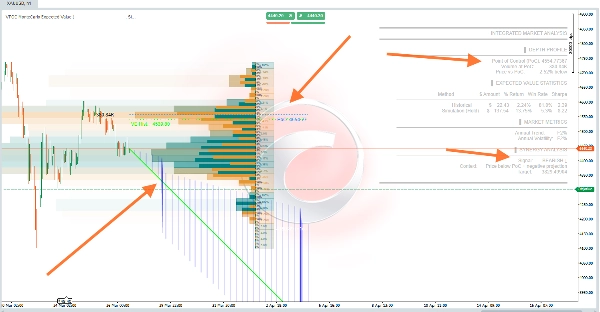
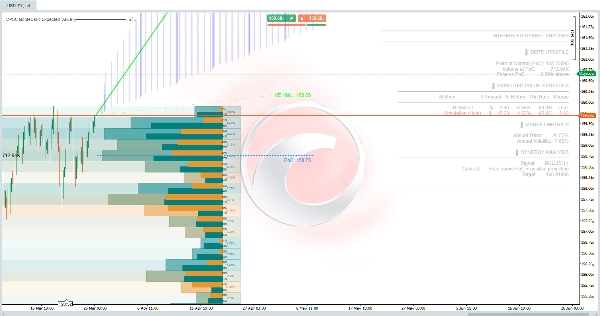
🖼️ 图表上的视觉元素
表格
元素 颜色 含义
成交量轮廓 橙色/蓝色渐变 按价格水平的活动集中度 🎨
PoC线 蓝色虚线 未来投影的控制点 🔵
EV预测线 绿色/品红色 预期价格轨迹 🟢🔴
±1σ带 白色虚线 68%置信区间 📊
历史EV线 绿色虚线 基于历史数据的期望值 🟢
预测区 半透明蓝色填充 带间概率区域 🔵
⚠️ 重要 - 限制
- 不是买卖信号 - 它是概率分析工具 🛠️
- 蒙特卡洛模拟假设历史分布有效(不预测黑天鹅事件)🦢❌
- PoC是动态的 - 每根新K线重新计算 🔄
- 需要足够的历史数据 - 最少252根K线以保证预测可靠 📊
- 加密货币 - 指标自动调整为365个交易日,传统市场为252个 🪙
💡 推荐使用策略
- 寻找机会 ★ 💡 - 价格低于PoC但有正向预测(可能被低估)
- 确认胜率 > 50% - 更高的统计成功概率 ✅
- 避免背离 ⚠️ ⚠️ - 价格相对于实际成交量被高估
- 以PoC为参考 - 在该流动性水平附近设置止损或目标 🎯
- 比较历史与模拟 - 若差异大,说明市场状态在变化 🔄
摘要
Using Monte Carlo simulations with default 1,000 iterations, it projects future price scenarios based on historical trends and volatility, applying a geometric Brownian motion model. This generates expected price trajectories with confidence bands (±1 standard deviation), estimating probabilities of success, risk-adjusted returns (Sharpe ratio), and potential target levels.
The combined analysis produces contextual signals such as Bullish, Bearish, Opportunity, and Divergence, based on price relation to PoC and projection direction. It supports various markets including Forex, stocks, commodities, indices, and cryptocurrencies, adjusting parameters like trading days accordingly.
Key configurable settings include analysis period, profile resolution, simulation count, and risk-free rate. Visual elements on the chart display volume profiles, PoC lines, expected value projections, and confidence intervals. The tool is designed for probabilistic market assessment and trade confirmation rather than direct buy/sell signals.


!["[Stellar Strategies] Market Session Ultimate" 标识](https://cdn.ctrader.com/image/webp/61ffd537-0125-4246-9e72-42eca1791d64_28232)
