
说明
Pinescriptlabs 商店指标: Pinescriptlabs 商店 cBots : (cBot) Gold & BTC 突破会话枢轴(新)
价格行为 (新)
公平价值缺口会话 📊💰
公平价值缺口(FVG)指标是一种复杂的交易工具,旨在识别和突出特定交易会话中被称为“公平价值缺口”的暂时性市场低效 🚨。这些缺口代表市场价格快速移动的时刻 ⚡,造成买卖双方之间的不平衡。
关键技术机制 🔧
基于会话的架构 🕒
• 实施精确且可配置的基于会话的分析方法
• 允许交易者定义自定义会话开始时间,支持 UTC 或本地时区 🌍
• 创建动态会话边界,重置并跟踪市场行为 🔄
公平价值缺口检测逻辑 🔎
• 利用多个连续价格条的高级价格行为分析
• 通过比较识别缺口:
o 连续条的最高价和最低价 📈📉
o 前一条的收盘价 ✅
o 当前条的价格结构 🔄
缺口分类 🏷️
该指标区分两种主要缺口类型:
- 看涨公平价值缺口 📈
o 当价格跳升至前高之上时发生 🔺
o 表示潜在的市场上行动能 🚀
o 预示可能的买入压力 💸 - 看跌公平价值缺口 📉
o 当价格跌破前低时发生 🔻
o 表明潜在的市场下行动能 ⬇️
o 预示可能的卖出压力 🛑
交易应用 📱💼
战略洞察 💡
• 帮助交易者可视化市场低效 🖼️
• 提供潜在趋势反转的早期警告 ⚠️
• 提供精确的进出场点识别 🎯
风险管理功能 🛡️
• 缺口状态的颜色编码可视化 🎨
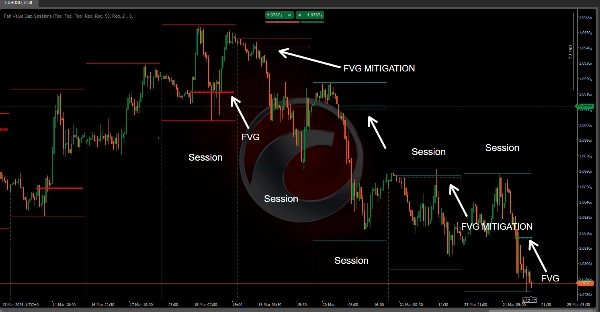
• 跟踪缺口“缓解”(当价格回到缺口区域)↔️
• 允许为不同市场条件自定义颜色设置 🎨
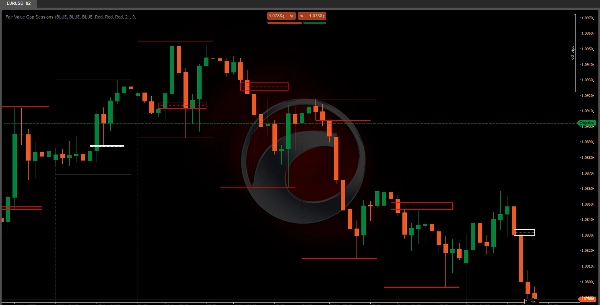
技术可视化 🎨
该指标创建两个主要视觉元素:
- 缺口区域矩形 🟩
o 代表识别出的缺口价格范围 📐
o 在整个交易会话中动态延伸 ➡️
o 根据缺口状态(活跃/缓解)改变颜色 🟩➡️🟨 - 水平线 📏
o 位于缺口中点 ⚫
o 帮助交易者快速识别缺口的中心价格区 📍
o 使用不同线型表示缺口状态 ➔
实用交易策略 📝
入场信号策略 🚦
• 利用缺口检测作为潜在趋势延续信号 🔄
• 寻找价格回归(缓解)缺口作为确认 ✅
• 与其他技术指标结合以增强决策能力 🤝
风险管理技巧 🛡️
• 在缺口边界附近设置止损 ⛔
• 使用缺口中点作为潜在支撑/阻力位 🪜
• 监控缺口缓解作为潜在趋势反转指标 ↔️⚠️
配置灵活性 ⚙️
• 可自定义会话开始时间 ⏰
• 时区配置(UTC/本地)🌍
通过理解并正确应用公平价值缺口会话指标,交易者可以更深入地洞察市场动态,识别潜在交易机会,并基于价格行为低效做出更明智的决策。 🧠📈
摘要
It classifies gaps into two types: bullish gaps, indicating potential upward momentum and buying pressure, and bearish gaps, signaling possible downward momentum and selling pressure. Visually, it represents gaps with dynamic rectangles showing the price range and a midpoint level line to help traders quickly locate the gap's central price zone. Colors and line styles change to reflect the gap's active or mitigated status.
Traders can use this tool to visualize market inefficiencies, receive early warnings of trend reversals, and identify precise entry and exit points. Risk management features include color-coded gap states, tracking of gap mitigation when price returns to the gap zone, and customizable color settings. The indicator supports practical strategies such as using gap detection for trend continuation signals and combining it with other indicators for decision-making. Stop-loss placement near gap boundaries and monitoring gap mitigation for trend reversal are also supported.
客户评价
5 | 100 % | |
4 | 0 % | |
3 | 0 % | |
2 | 0 % | |
1 | 0 % |


