
说明
VOLUME PROFILE 更新版本
与 之前的版本相比,此更新版本包含关键的错误修复、新功能和显著的性能提升:
修复
- 修正了成交量分布:基于蜡烛重叠的比例分配,而非对所有触及级别均分100%
- 修正了 VAH/VAL 检测:容差随级别高度缩放,而非硬编码值
- 修正了文本定位:基于动态时间框架的偏移,而非硬编码天数
- 修正了日期时间验证:空白柱检查,超出范围验证
功能
- 为日期时间配置文件添加时区偏移参数
- 为回溯模式添加文本位置参数(左/右)
- 日期时间模式标签现在跟随柱边缘(可变宽度)或对齐于配置文件边缘(全宽度)
性能
- 日期时间索引查找采用二分查找(之前为 O(n) 线性查找)
- 缓存总成交量计算(之前为每级别重新计算)
- 预设 TPO 字典大小以避免调整大小
- 字典查找采用 TryGetValue 模式
- 热路径中用基于索引的循环替代 foreach
清理
- 移除 ProfileWidth 参数(自动计算始终正确)
- 简化蜡烛交叉为单一条件
__________________________________________________________________________________________
重要提示 - 请先阅读
外汇成交量不是实际成交量
外汇中的成交量是“tick 成交量”——它统计价格变动的次数。它不计算交易了多少钱。
Tick 成交量无法显示的内容
- 交易规模。100美元交易和1,000万美元交易都计为1个tick。
- 真实资金流。你无法看到是大资金还是小资金推动了价格。
- 真实流动性。你看不到市场中有多少订单在等待。
- 银行活动。银行可以看到真实成交量数据,你看不到。
这意味着什么
Tick 成交量只显示价格变动的频率——而非背后的资金。这带来以下问题:
- 你无法追踪银行或机构。它们使用你无法访问的真实成交量数据。
- 你无法验证“聪明资金”理论。这些理论需要真实成交量,而非tick计数。
- 你无法判断真实流动性。Tick 活动不显示订单深度或真实市场强度。
- 你无法衡量真实买卖力量。许多小交易看起来和一笔大机构交易一样。
- 成交量激增可能是误导。激增可能只是算法噪音,而非真实交易兴趣。
如何正确使用此指标
- 将其视为活动计量器,而非资金计量器。高tick成交量=市场活跃,低tick成交量=市场安静,仅此而已。
- 比较不同时间的活动。用它来看:伦敦时段比纽约更忙吗?今天比昨天更活跃吗?趋势期比盘整期更忙吗?
- 结合价格结构。将支撑/阻力、摆动点或 BOS/ChoCH 与成交量一起使用。价格背景可防止成交量激增带来的假信号。
- 关注重要价格水平的活动。当价格测试关键水平且tick成交量增加时,意味着更多交易者活跃,但不代表大玩家介入。
- 不要假设它显示机构活动。Tick 成交量无法显示积累、大额订单或“聪明资金”。仅用它来衡量节奏和速度。
__________________________________________________________________________________________
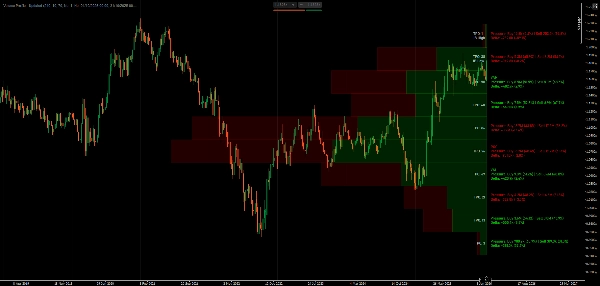
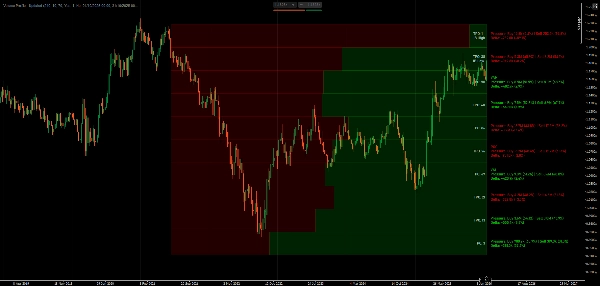
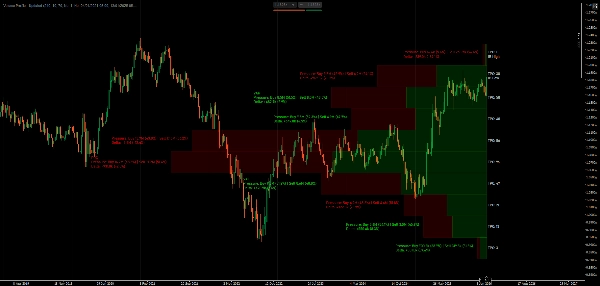
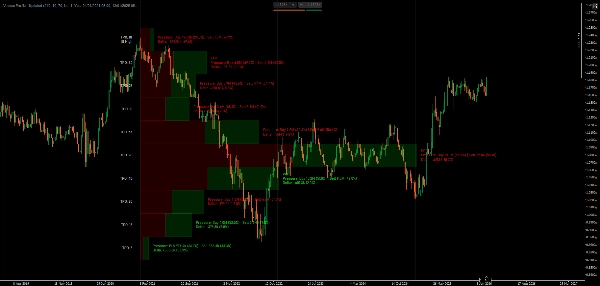
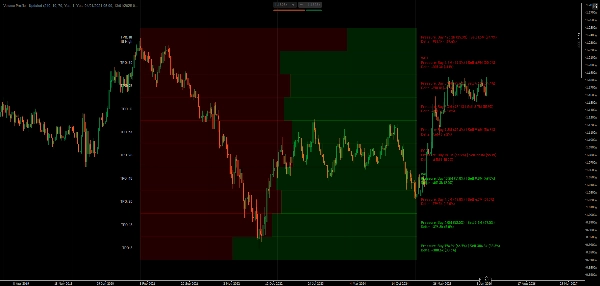
通过 POC、价值区和市场轮廓 TPO 跟踪可视化成交量分布和价格停留时间。
此指标使用市场轮廓概念显示成交量分布。它展示了控制点(最高tick活动级别)、价值区边界(大部分交易发生处)、TPO 字母序列(每个价格的停留时间)以及按蜡烛方向拆分的delta可视化。
你可以选择回溯周期或设置特定日期范围,显示成交量条为比例或全宽,切换显示所有级别或仅关键级别,并自定义多头/空头活动的颜色。
功能
成交量分布分析
- 控制点(POC):最高活动的价格级别——价格停留时间最长处
- 价值区(VA):可自定义的活动集中区(默认70%)——大部分交易发生处
- VAH/VAL:价值区高/低边界——潜在支撑/阻力水平
- Delta 可视化:拆分柱显示每个价格级别的蜡烛方向
市场轮廓 TPO
- 时间价格机会跟踪:统计每个价格的交易时间段数
- TPO 字母:价格停留时间的视觉表示(A-Z序列)
- 初始平衡(IB):首小时范围——日内交易结构重要
- IB 高/低标记:开盘区间极值
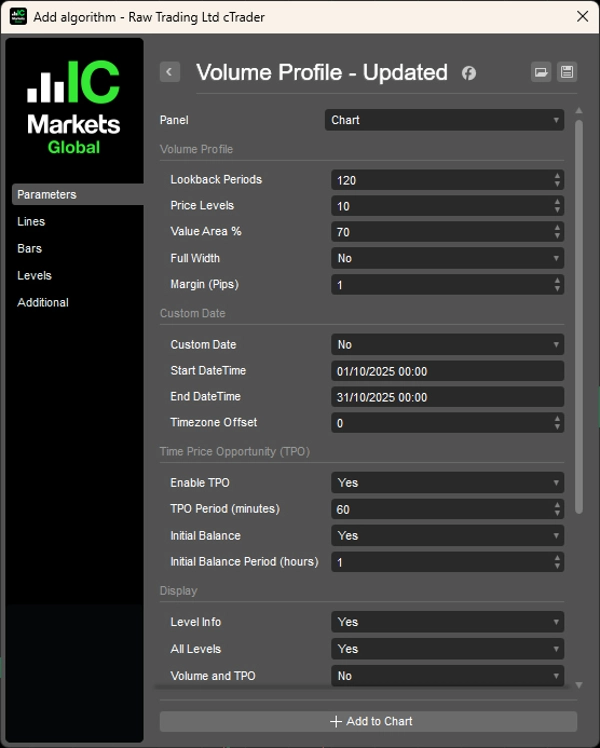
灵活的回溯选项
- 基于周期:设置分析的柱数(例如,最近120根柱)
- 日期时间范围:在特定日期/时间间锚定配置文件以进行事件分析
- 动态宽度:自动缩放或固定宽度配置文件
显示选项
- 成交量条:比例宽度(按活动缩放)或全宽均匀条
- 每个条内蜡烛方向拆分
- 带百分比的Delta计算
- 切换显示所有级别或仅关键级别(POC、VAH、VAL)
- 成交量/TPO 细节可见性控制
- 带百分比的方向性细分
- 可调字体大小和基于点差的边距
颜色自定义
- 多头/空头方向条的独立颜色
- 正负Delta的独立文本颜色
- TPO 特定文本颜色
性能优化
- 缓存时间查找和高效矩形绘制
- 最小化重新计算以保证流畅性能
- 基于蜡烛结构的专业级Delta计算
__________________________________________________________________________________________
更多免费指标
探索广泛的市场分析工具——从结构和成交量到回归、波动率和自定义时间框架。
源代码可在 GitHub 仓库中获得。
全部免费使用。但如果你想支持喝咖啡,可以通过 这里捐助。
支撑/阻力
成交量
移动平均线
实用工具/自定义
基于回归
波动率
振荡器
__________________________________________________________________________________________
免责声明
交易涉及风险。此指标仅用于技术分析——请始终应用适当的风险管理并负责任地交易。
反馈与改进
如果您有建议、功能请求或改进想法,请在讨论标签页留言。您的反馈有助于为所有人改进此指标。
摘要
Key features include customizable lookback periods based on bar count or specific date/time ranges, dynamic or fixed profile widths, and display options for proportional or full-width volume bars. Users can toggle visibility of all levels or key levels (POC, VAH, VAL) and adjust colors independently for bullish/bearish bars and delta text. The indicator tracks Initial Balance (IB) ranges and marks IB High/Low for day trading structure.
Performance optimizations include binary search for DateTime lookups, cached volume calculations, and efficient data structures to minimize recalculations. The indicator uses tick volume, which counts price changes rather than actual traded volume, making it suitable as a market activity meter rather than a measure of real money flow or liquidity.
Supported markets include Forex, Indices, Commodities, Crypto, and Stocks. The indicator is intended for technical analysis and includes parameters for timezone offset and text positioning.
客户评价
5 | 100 % | |
4 | 0 % | |
3 | 0 % | |
2 | 0 % | |
1 | 0 % |


