
说明
✔ 输入数据的网站,进入指标标签:https://tradingeconomics.com/
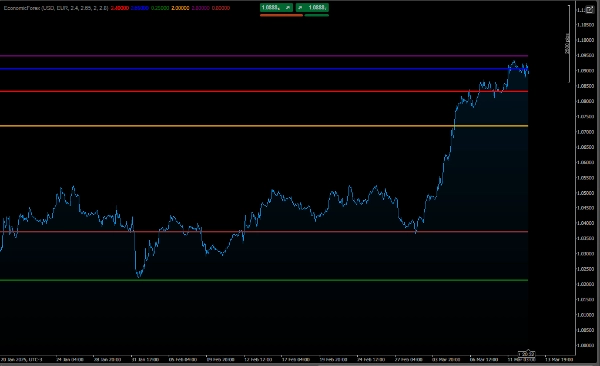
如何解读图表
名义利率和实际利率的区别:
名义利率是利率的总值。
实际利率考虑了通货膨胀,显示货币的实际购买力。
如果通胀率高于名义利率,实际利率将为负,表示购买力下降。
货币比较:
该图表允许您比较两种货币的经济状况。
例如,如果主要货币的实际利率高于对方货币,这可能表明主要货币在投资上更具吸引力。
随时间的演变:
曲线显示通胀率、名义利率和实际利率随时间的变化,帮助您识别趋势。
使用示例
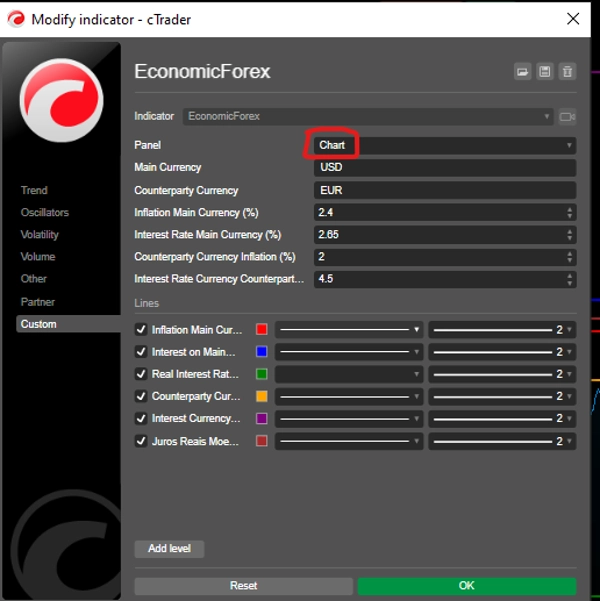
假设您设置的参数如下:
主要货币:USD(美元)
通胀率:5%
名义利率:6.5%
对方货币:EUR(欧元)
通胀率:2%
名义利率:4%
图表将显示:
USD:
实际利率:1.5%(6.5% - 5%)
EUR:
实际利率:2%(4% - 2%)
通过这些,您可以比较USD和EUR的经济状况,并在外汇市场做出明智的决策。
结论
这段代码是交易者和分析师监控和比较外汇对中两种货币经济指标的有用工具。它提供了对通胀、名义利率和实际利率的洞察,帮助理解宏观经济形势及其对外汇市场的影响。
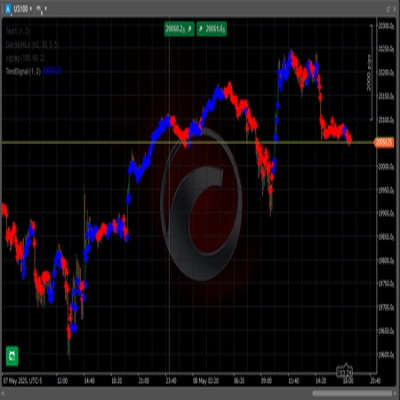
看看这个低风险算法:👇🏻
https://ctrader.com/pt/products/601?u=carneiroads
https://ctrader.com/pt/products/623?u=carneiroads
摘要
AI 摘要
EconomicForex is an indicator designed for forex traders and analysts to monitor and compare key economic indicators of two currencies within a forex pair. It visualizes inflation rates, nominal interest rates, and real interest rates on a line chart, enabling users to assess the macroeconomic environment and its impact on currency valuation.
The indicator distinguishes between nominal interest rates (the gross interest rate) and real interest rates (adjusted for inflation), highlighting the purchasing power of money. It allows comparison of economic conditions between a main currency and a counterparty currency by plotting their respective inflation, nominal, and real interest rates over time. This helps identify trends and relative investment attractiveness; for example, a higher real interest rate in the main currency compared to the counterpart may indicate greater investment appeal.
Users input data such as inflation and nominal interest rates for each currency, which can be sourced from economic data websites like TradingEconomics.com. The tool supports informed decision-making in the forex market by providing a clear view of evolving economic factors affecting currency pairs.
指标配置
客户评价
0.0
评价:0
客户评价
该产品尚无评价。已经试过了?抢先告诉其他人!
讨论
常见问答
Forex
EURUSD
cTrader Store 提供的所有产品,包括交易机器人、指标和插件,均由第三方开发者提供,仅供信息参考和技术访问之用。cTrader Store 并非经纪商,不提供投资建议、个人推荐或任何未来业绩保证。


价格
117
销售
9.86K
免费安装