
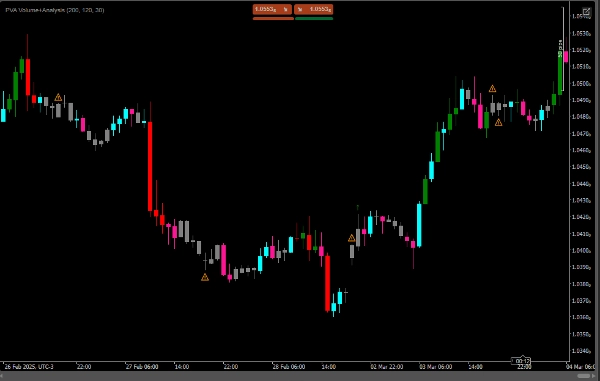
PVA(价格-成交量分析)是一种技术分析方法,研究金融资产的价格与交易量之间的关系。PVA的核心理念是,交易量可以提供有关趋势强度和方向的重要信息,帮助交易者做出更明智的决策。
- 价格上涨且成交量增加:表示强劲的上升趋势,显示绿色符号(向上箭头)。
- 价格下跌且成交量增加:表示强劲的下降趋势,显示红色符号(向下箭头)。
- 价格上涨且成交量减少:表示上升趋势可能正在减弱,显示橙色警告(警告符号)。
- 价格下跌且成交量减少:表示下降趋势可能正在减弱,也显示橙色警告(警告符号)。
- 如果成交量在上升或下降过程中减少,则绘制警告标记(⚠️)。
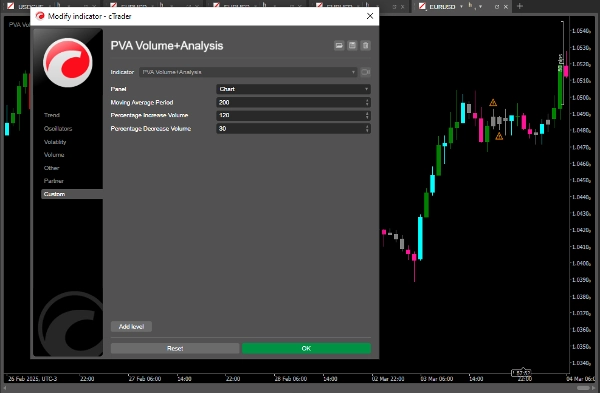
指标配置
5.0
评价:3
5 | 100 % | |
4 | 0 % | |
3 | 0 % | |
2 | 0 % | |
1 | 0 % |
客户评价
January 28, 2026
August 12, 2025
Pros: Detailed price-volume analysis, highlights high-activity zones, useful for VSA trading. Cons: No alerts, no MTF mode, can be resource-heavy with large history. Requires experience to interpret.
May 13, 2025
cTrader Store 提供的所有产品,包括交易机器人、指标和插件,均由第三方开发者提供,仅供信息参考和技术访问之用。cTrader Store 并非经纪商,不提供投资建议、个人推荐或任何未来业绩保证。


111
销售
8.36K
免费安装