
说明
MAGIC BLOCK STRATEGY 指标结合了两种主要的市场分析方法:
订单区块检测:
基于回溯期内未被打破的高点和低点识别支撑和阻力区域。
当价格收盘高于未被打破的低点时,生成买入信号。
当价格收盘低于未被打破的高点时,生成卖出信号。
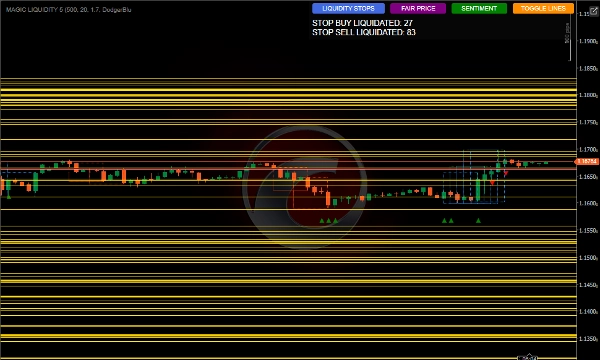
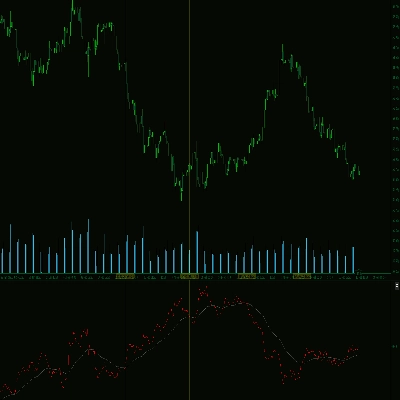
流动性分析:
检测可能集中止损的流动性池区域。
监控买卖止损的触发情况。
基于流动性分布计算市场情绪。
识别交易最活跃的公平价格。
最佳使用方法
初始配置
回溯期:根据您交易的时间框架调整回溯期参数,较高时间框架使用较高数值。
分析蜡烛数量:保持在500以获得稳健分析,或减少以获得更快反应。
流动性池颜色:选择在图表上醒目的颜色。
信号解读
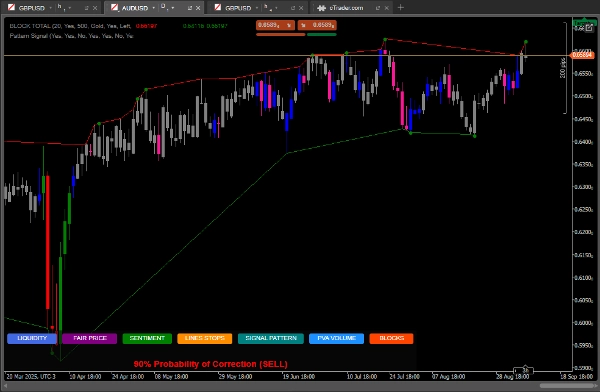
订单区块信号:
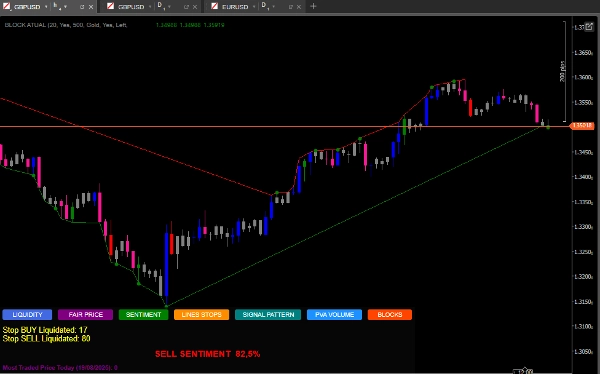
绿色点:当价格收盘高于未被打破的低点时的买入信号。
红色点:当价格收盘低于未被打破的高点时的卖出信号。
流动性池:
水平线显示流动性区域,可能是目标或反转点。
监控当前价格上下的流动性关系。
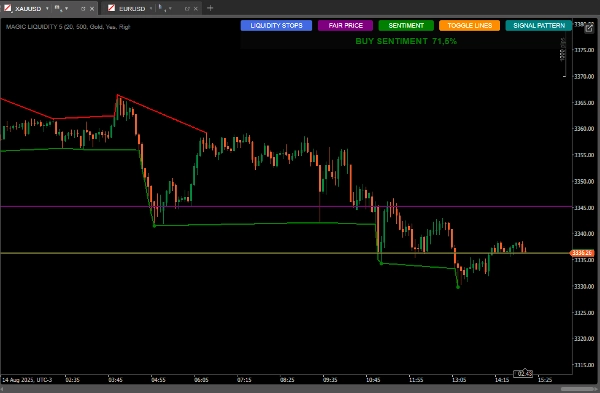
市场情绪:
使用 SENTIMENT 按钮查看主导方向和信心。
高信心的买入情绪表明持续增长,高信心的卖出情绪表明看跌延续。
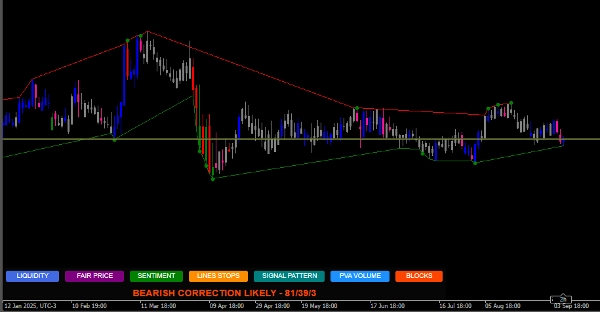
蜡烛图形态:
SIGNAL PATTERN 按钮分析并
基于定量比率显示修正概率
最活跃交易价格公平价:
PRICE 按钮显示当天交易量最高的价格水平。
它可以作为价格的磁铁或支撑/阻力。
使用策略
保守策略:
仅当订单区块信号与主导情绪一致时进行交易。
将流动性池作为获利目标。
激进策略:
当价格接近积累大量止损的流动性池时,预期反转。
利用情绪与价格行为之间的背离进行逆势交易。
额外确认:
与指标显示的蜡烛图形态进行比较。
检查公平价是否在附近作为关注区域。
风险管理。
止损:
买入时置于最近订单区块下方
卖出时置于最近订单区块上方
获利:
目标设在附近的流动性池
考虑上下流动性比率来设定目标
高级提示
使用 TOGGLE LINES 按钮在图表变得杂乱时禁用流动性线
监控已清算止损的数量以评估行情力度
公平价在区间震荡市场中特别有用,如动态支撑/阻力
结合其他指标进行确认,如成交量、移动平均线
SIGNAL PATTERN 可用于 D1 时间框架。
https://ctrader.com/pt/products/1725?u=Goulart
https://ctrader.com/pt/products/1386?u=Goulart
摘要
The indicator also analyzes liquidity pools, highlighting areas where stop losses may accumulate and monitoring the activation of buy and sell stops. It calculates market sentiment based on liquidity distribution and identifies the most traded price level of the day, which can act as dynamic support or resistance.
Users can customize parameters such as lookback period and number of candles for analysis to suit different timeframes and trading styles. Visual signals include green and red dots for buy and sell order block signals, horizontal lines for liquidity pools, and sentiment indicators showing prevailing market direction and confidence.
The tool supports conservative strategies that align order block signals with sentiment and use liquidity pools as profit targets, as well as aggressive strategies that anticipate reversals near liquidity pools and exploit divergences between sentiment and price action. Additional features include candlestick pattern correction probabilities and options to toggle liquidity lines for chart clarity. Risk management guidance suggests placing stop-loss orders relative to recent order blocks and setting take-profit targets near liquidity pools.


!["High-Low Divergence [Iridio Capital]" 标识](https://cdn.ctrader.com/image/webp/443c4661-7abb-40f1-842f-4b6ec560649b_40914)


!["[Stellar Strategies] Market Session Ultimate" 标识](https://cdn.ctrader.com/image/webp/61ffd537-0125-4246-9e72-42eca1791d64_28232)


