说明
用这个信号指标完善您的策略👇🏻
https://ctrader.com/pt/products/1560?u=Goulart
✔指标功能
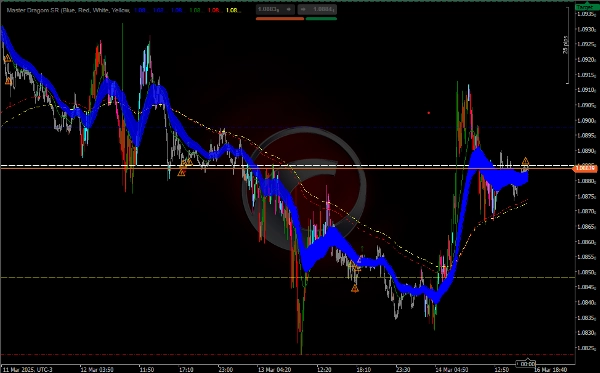
支撑和阻力 (SR):
该指标绘制每日、每周和每月的支撑和阻力水平的水平线。
您可以根据需要启用或禁用每个级别(开盘价、收盘价、最高价和最低价)。
指数移动平均线 (EMA):
该指标计算多个EMA(50、25、200和233周期),以帮助识别趋势和潜在的动态支撑/阻力区域。
EMA以不同颜色绘制在图表上,便于查看。
成交量分析 (PVAVolumeAnalysis):
该指标分析成交量以识别潜在的趋势反转或延续。
它用图标(↑,↓,⚠️)突出显示成交量高于平均水平的柱状图,并标示成交量的显著变化。
柱状图着色:
柱状图根据成交量和价格方向(上涨或下跌)着色,有助于识别趋势的强度。
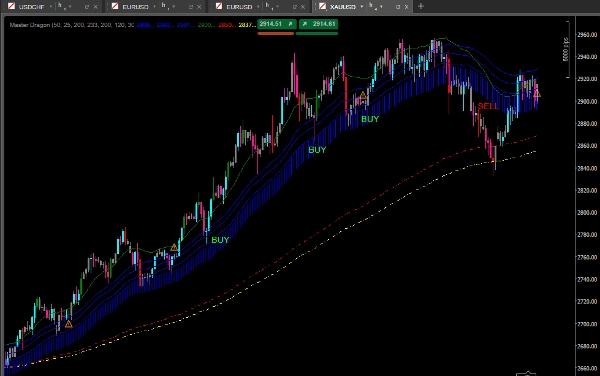
使用EMA进行趋势分析:
使用EMA识别趋势方向:
如果价格高于EMA(尤其是200和233 EMA),趋势为上涨。
如果价格低于EMA,趋势为下跌。
50 EMA的高点和低点之间的区域可用作潜在反转或延续的关注区。
成交量分析:
观察图标和柱状图颜色以识别成交量变化:
成交量高且价格上涨(↑):确认上涨趋势。
成交量高且价格下跌(↓):确认下跌趋势。
成交量低且价格上涨或下跌(⚠️):可能反转。
信号组合:
结合成交量、EMA和SR水平的信号来做出进出场决策。
例如,如果价格接近阻力位且成交量减少,可能是反转信号。
建议策略
带成交量确认的趋势策略
识别趋势:
使用EMA(200和233)确定主要趋势。
如果价格高于EMA,只考虑买入。
如果价格低于EMA,只考虑卖出。
等待回调:
等待价格回到较短周期的EMA(50或25)或SR水平。
成交量确认:
检查成交量是否沿趋势方向增加(买入为↑,卖出为↓)。
MA定位趋势、回调、信号成交量、反转、支撑和阻力。
如果成交量减少(⚠️),避免进场或考虑反转。
进场:
当价格高于EMA且接近支撑位,成交量确认上涨趋势时买入。
当价格低于EMA且接近阻力位,成交量确认下跌趋势时卖出。
出场:
使用SR水平或EMA作为目标或出场点。
例如,接近支撑位时平仓或卖出。
摘要
Volume analysis is integrated to detect potential trend reversals or continuations by highlighting bars with above-average volume and signaling significant volume changes using icons (↑ for rising volume confirming uptrends, ↓ for falling volume confirming downtrends, and ⚠️ for low volume indicating possible reversals). Bars are color-coded based on volume and price direction to visually represent trend strength.
Traders can combine signals from volume, EMAs, and support/resistance levels to make informed entry and exit decisions. A suggested strategy involves identifying the main trend using the 200 and 233 EMAs, waiting for pullbacks to shorter EMAs or support/resistance levels, and confirming with volume signals before entering trades. Exit points can be set at support/resistance levels or EMA lines. This indicator is suitable for enhancing trend, pullback, volume, reversal, and support/resistance analysis in various trading strategies.
客户评价
5 | 100 % | |
4 | 0 % | |
3 | 0 % | |
2 | 0 % | |
1 | 0 % |