


说明
| 全能交易专家 |
## 这个指标是什么?
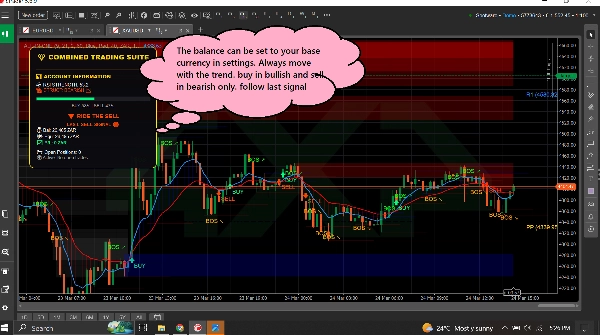
这个指标同时在你的图表上放置了**三个有用的交易工具**。可以把它想象成有三位专家交易员同时给你他们的意见。
=====================================================
## 这三种工具
### 1. 趋势仪表盘(趋势追踪器)
**功能:** 告诉你市场的运动方向以及运动的强度。
**你看到的是:**
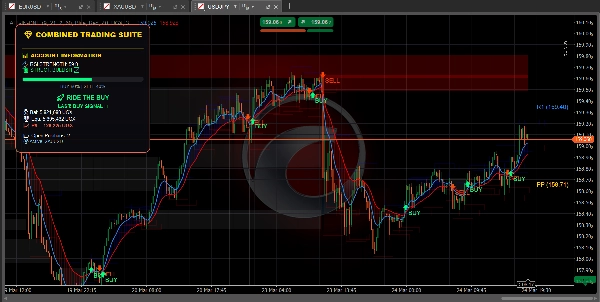
- **蓝线** = 快速移动平均线(短期趋势)
- **红线** = 慢速移动平均线(长期趋势)
- **蓝色云层** = 上升趋势(价格上涨)
- **红色云层** = 下降趋势(价格下跌)
- **绿色箭头** = 出现买入信号
- **红色箭头** = 出现卖出信号
- **RSI柱状图** = 显示市场是否超买(过高)或超卖(过低)
========================================================
**还显示:**
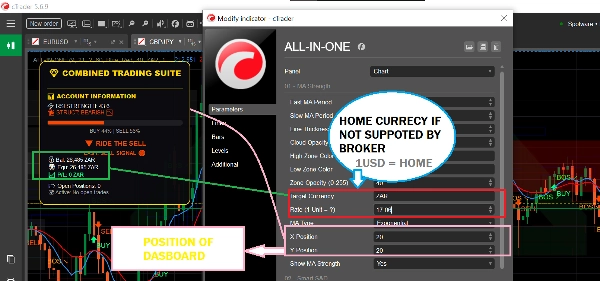
- 你的账户余额和盈亏
- 你持有多少个仓位
- 简单的文字建议,如“安全买入”或“跟随买入”
============================================================
### 2. 供需区(关键水平查找器)
**功能:** 找出市场可能反转或停滞的重要价格水平。
**你看到的是:**
- **蓝色方框** = 需求区(买家介入区域——适合买入)
- **红色方框** = 供应区(卖家介入区域——适合卖出)
- **灰色方框** = 已测试区域(可靠性较低)
============================================================
**使用方法:**
- 价格向下接近蓝色方框?考虑买入
- 价格向上接近红色方框?考虑卖出
- 新鲜(明亮)的方框比灰色的更有效
============================================================
**还显示:**
- **BOS ↗** = 市场突破向上,趋势可能继续上涨
- **BOS ↘** = 市场突破向下,趋势可能继续下跌
============================================================
### 3. 支点(支撑与阻力水平)
**功能:** 自动计算市场经常停止或转向的价格水平。
**你看到的是:**
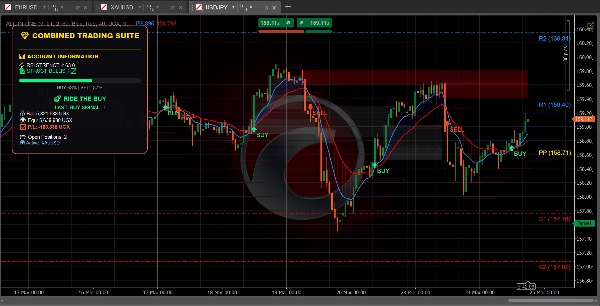
- **金线** = 支点(中心水平)
- **蓝线** = 阻力水平(价格可能在此下跌)
- **红线** = 支撑水平(价格可能在此上涨)
============================================================
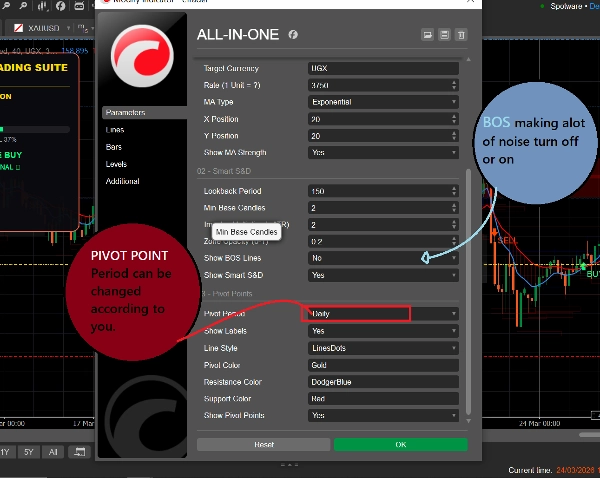
**你可以选择:**
- **每日** = 水平每天变化一次
- **每周** = 水平每周变化一次
- **每月** = 水平每月变化一次
- **15分钟** = 水平每15分钟变化一次(适合快速交易)
============================================================
## 简单使用方法
### 寻找买入交易:
1. 等待价格达到**蓝色需求区**
2. 检查蓝色MA线是否在红色MA线之上(上升趋势)
3. 只有当市场处于正确趋势时,信号才应被遵循
============================================================
### 寻找卖出交易:
1. 等待价格达到**红色供应区**
2. 检查红色MA线是否在蓝色MA线之上(下降趋势)
3. 只有当市场处于正确趋势时,信号才应被遵循
============================================================
### 寻找快速交易:
1. 使用15分钟支点获得精确水平
2. 关注BOS箭头判断趋势方向
3. 检查仪表盘了解市场强度
4. 进行与方向匹配的交易
============================================================
## 所有颜色的含义
| 颜色 | 含义 |
| 🟦 蓝色 | 看涨 / 买入信号 / 需求区 / 阻力支点 |
| 🔴 红色 | 看跌 / 卖出信号 / 供应区 / 支撑支点 |
| 🟨 金色 | 支点(中心水平) |
| ⚪ 灰色 | 已测试区域(已访问过) |
| 🟢 绿色箭头 | 买入信号 |
| 🔴 红色箭头 | 卖出信号 |
============================================================
## 初学者的简单设置
============================================================
### 快速交易(剥头皮):
- 支点周期:**15分钟**
- 快速MA:**5**
- 慢速MA:**13**
- 开启:全部三种工具
============================================================
### 日内交易:
- 支点周期:**每日**
- 快速MA:**9**
- 慢速MA:**21**
- 开启:全部三种工具
============================================================
### 长期交易:
- 支点周期:**每周**
- 快速MA:**21**
- 慢速MA:**55**
- 开启:趋势仪表盘 + 支点
=========================================================
## 需要记住的一条规则
=========================================================
**当工具意见不一致时,不要交易!**
如果仪表盘显示买入,但价格处于红色供应区——请等待明确的信号。
如果仪表盘显示卖出,但价格处于蓝色需求区——请等待明确的信号。
最佳交易发生在所有工具指向同一方向时。
============================================================
## 快速入门
1. 将指标添加到你的图表
2. 开始时保持所有设置为默认
3. 观察价格在彩色方框和线条处的表现
4. 几天后,根据你的风格调整设置
5. 使用仪表盘实时监控你的账户
============================================================
就是这样!三种工具,一个指标,简单交易。
摘要
1. Trend Dashboard: Displays short-term (blue line) and long-term (red line) moving averages, colored clouds indicating uptrend (blue) or downtrend (red), buy (green arrow) and sell (red arrow) signals, and an RSI bar showing overbought or oversold conditions. It also shows account balance, open positions, and simple text advice.
2. Supply & Demand Zones: Highlights important price levels with blue boxes for demand zones (buying areas), red boxes for supply zones (selling areas), and gray boxes for tested zones (less reliable). It includes breakout signals (BOS arrows) indicating potential trend continuation.
3. Pivot Points: Automatically calculates support and resistance levels with a gold pivot point line, blue resistance lines, and red support lines. Users can select pivot periods from 15-minute to monthly intervals for different trading styles.
The indicator supports multiple markets including Forex, Crypto, Stocks, and Indices, and provides visual signals such as crossovers, breakouts, and level touches. It is designed for various trading styles, from scalping to long-term trading, with recommended settings for each. The tool emphasizes trading only when all three components align in direction to improve trade clarity and consistency.
客户评价
5 | 100 % | |
4 | 0 % | |
3 | 0 % | |
2 | 0 % | |
1 | 0 % |
讨论
常见问答
该作者的其他作品


























价格