
Mô tả
Thuật Toán Thông Minh Theo Sau
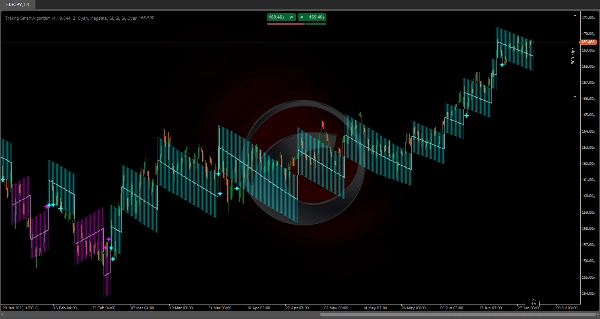
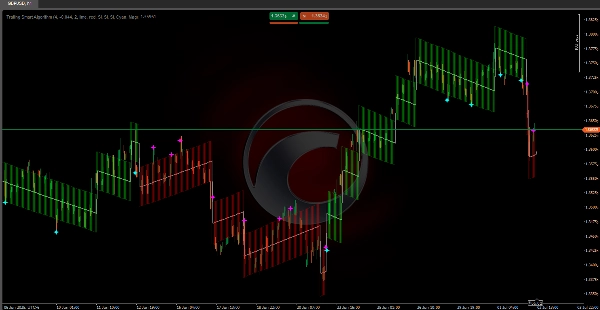
https://chartshots.spotware.com/c/69f0f1d89000b
Kết hợp các thuật toán toán học 🧠 được thiết kế đặc biệt để theo dõi giá một cách nhất quán trong bất kỳ điều kiện thị trường nào 🌐.
Cấu trúc tính toán của nó đảm bảo đường xu hướng luôn đồng bộ với các biến động giá, tránh sự trễ điển hình của các chỉ báo truyền thống ⏳.
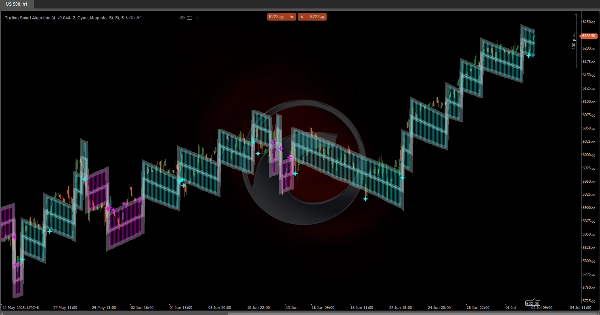
Không giống như các thuật toán thông thường, hệ thống này sử dụng đo lường biến động chính xác 📊 và áp dụng điều chỉnh tự động ⚙️ đảm bảo theo dõi tối ưu. Các phép tính nội bộ được xây dựng để cung cấp một biểu diễn chính xác về hướng thị trường, duy trì độ chính xác trong cả những biến động nhanh ⚡ và sự phát triển xu hướng dần dần 🕊️.
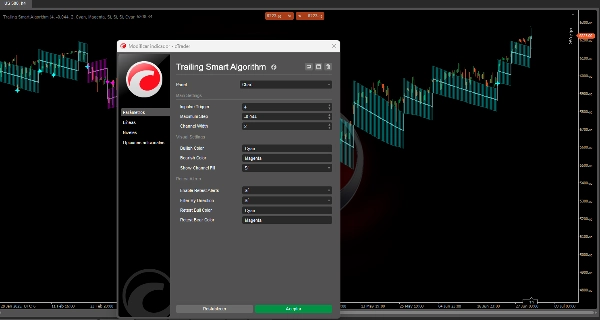
https://chartshots.spotware.com/c/69f0f218591b0
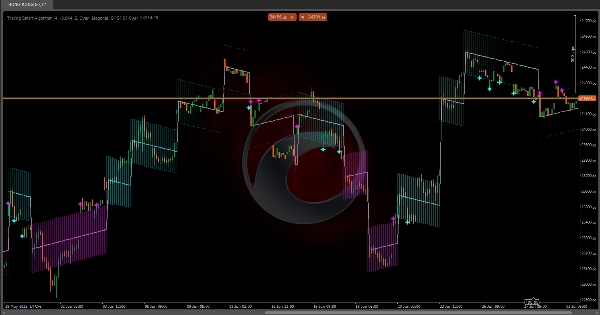
💡 Nó hoạt động như thế nào?
Chỉ báo hoạt động bằng cách sử dụng một hệ thống bước thích ứng di chuyển theo hướng của xu hướng chiếm ưu thế.
Nó dựa trên ba thành phần chính:
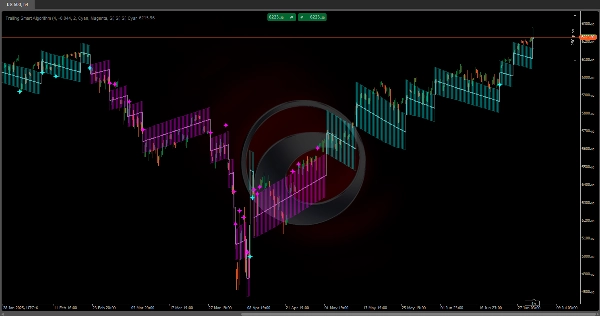
https://chartshots.spotware.com/c/69f0f2b19e4d3
1️⃣ Phát Hiện Thay Đổi Xu Hướng
Hệ thống liên tục theo dõi giá để phát hiện các chuyển động đáng kể vượt quá ngưỡng cụ thể (Kích Hoạt Xung Lực 🎯).
Khi giá di chuyển đủ xa khỏi đường xu hướng hiện tại, chỉ báo nhận biết một thay đổi hướng tiềm năng và điều chỉnh lại đường chính của nó.
2️⃣ Theo Dõi Động
Khi hướng đã được xác định, đường xu hướng di chuyển từng bước một 🪜 cùng hướng với thị trường.
Mỗi bước được tính toán dựa trên biến động hiện tại (ATR 📈):
• Trong thị trường biến động mạnh hơn, các bước lớn hơn 🌊
• Trong thị trường yên tĩnh hơn, các bước nhỏ hơn 🌿
3️⃣ Kênh Biến Động
Một kênh hình thành xung quanh đường chính (dải trên và dải dưới) đại diện cho vùng biến động bình thường 📉📈.
Kênh này giúp xác định liệu giá đang hoạt động trong phạm vi bình thường hay đang có biến động cực đoan 🚨.
📏 Kênh Biến Động
• Dải Trên: Giới hạn trên của kênh biến động
• Dải Dưới: Giới hạn dưới của kênh biến động
✨ Tín Hiệu Kiểm Tra Lại
• Sao Xanh Lơ 🌟: Giá chạm hoặc vượt qua dải dưới trong một xu hướng tăng
• Sao Hồng 🌟: Giá chạm hoặc vượt qua dải trên trong một xu hướng giảm
⚙️ Cài Đặt Tham Số
🔹 Tham Số Chính
Kích Hoạt Xung Lực (giá trị mặc định: 4)
Nó làm gì?
Xác định độ nhạy để phát hiện thay đổi xu hướng. Đây là hệ số nhân ATR xác định mức độ di chuyển giá cần thiết để kích hoạt thay đổi hướng.
Ảnh hưởng khi thay đổi:
• Giá trị cao hơn (5–8):
- Kháng cự tốt hơn với thay đổi xu hướng 🛡️
- Ít tín hiệu sai hơn
- Phản ứng chậm hơn với các chuyển biến thực sự
• Giá trị thấp hơn (2–3):
- Độ nhạy cao hơn 🎯
- Phản ứng nhanh hơn
- Dễ tạo ra tín hiệu sai trong thị trường đi ngang
Bước Tối Đa (giá trị mặc định: -0.044)
Nó làm gì?
Giới hạn kích thước tối đa của mỗi bước mà đường xu hướng có thể thực hiện. Đây là một giá trị âm hoạt động như một giới hạn.
Ảnh hưởng khi thay đổi:
• Ít âm hơn (-0.020 đến -0.030):
- Các bước lớn hơn 🚀
- Theo dõi xu hướng quyết liệt hơn
• Âm hơn (-0.050 đến -0.080):
- Các bước nhỏ hơn, dần dần hơn 🌱
- Theo dõi thận trọng hơn
Chiều Rộng Kênh (giá trị mặc định: 2)
Nó làm gì?
Xác định chiều rộng của kênh biến động xung quanh đường chính.
Ảnh hưởng khi thay đổi:
• Giá trị cao hơn (3–4):
- Kênh rộng hơn 🟢
- Ít tín hiệu kiểm tra lại hơn
- Độ chịu đựng biến động cao hơn
• Giá trị thấp hơn (1–1.5):
- Kênh hẹp hơn 🔴
- Nhiều tín hiệu kiểm tra lại hơn
- Nhạy cảm hơn với nhiễu
🎨 Tham Số Hình Ảnh
Màu Tăng Giá / Màu Giảm Giá
Xác định màu sắc cho xu hướng tăng và xu hướng giảm tương ứng.
Hiển Thị Màu Nền Kênh
Bật hoặc tắt màu nền hiển thị của kênh biến động 🌈.
🔔 Cài Đặt Kiểm Tra Lại
Bật Cảnh Báo Kiểm Tra Lại
Chuyển đổi tín hiệu kiểm tra lại khi giá chạm các dải kênh.
Lọc Theo Hướng
Khi bật, chỉ hiển thị tín hiệu kiểm tra lại phù hợp với xu hướng hiện tại:
• Trong một xu hướng tăng: Chỉ tín hiệu trên dải dưới
• Trong một xu hướng giảm: Chỉ tín hiệu trên dải trên
🌟 Tóm Tắt Tín Hiệu Kiểm Tra Lại
• Sao Xanh Lơ trên Dải Dưới: Tiềm năng điều chỉnh tăng giá từ hỗ trợ động ✅
• Sao Hồng trên Dải Trên: Tiềm năng điều chỉnh giảm giá từ kháng cự động ❌
Tóm tắt
Đánh giá của khách hàng
5 | 100 % | |
4 | 0 % | |
3 | 0 % | |
2 | 0 % | |
1 | 0 % |


