
Nadaraya-Watson Kernel Regression
指标
134 下载
版本 1.0, Nov 2025
Windows 版、Mac 版
5.0
评价:1
说明
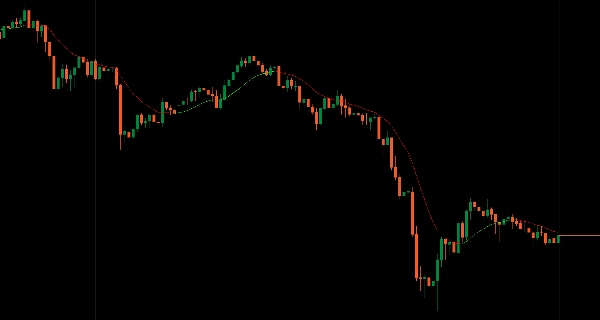
使用核加权回归数学的自适应趋势分析。
应用高斯核加权,附近的柱子影响更大,远处的柱子指数衰减,创建超平滑的趋势线,无固定周期滞后。
自动调整到局部价格结构,与传统移动平均线相比滞后最小,动态颜色编码(青柠色表示上升趋势,红色表示下降趋势),可调带宽以调节响应性,灵活的回溯窗口(50-2000根柱子),以及双色无噪声设计,为寻求自适应平滑且无需任意周期选择的交易者提供数学上精确的趋势识别。
特征
核加权计算
- 附近的柱子影响更大,远处的柱子指数衰减——无任意固定周期
- 高斯核加权,实现数学上最优的平滑效果
- 自动适应局部价格结构,无需手动重新校准
- 最小滞后:比等效移动平均线更快响应真实趋势变化
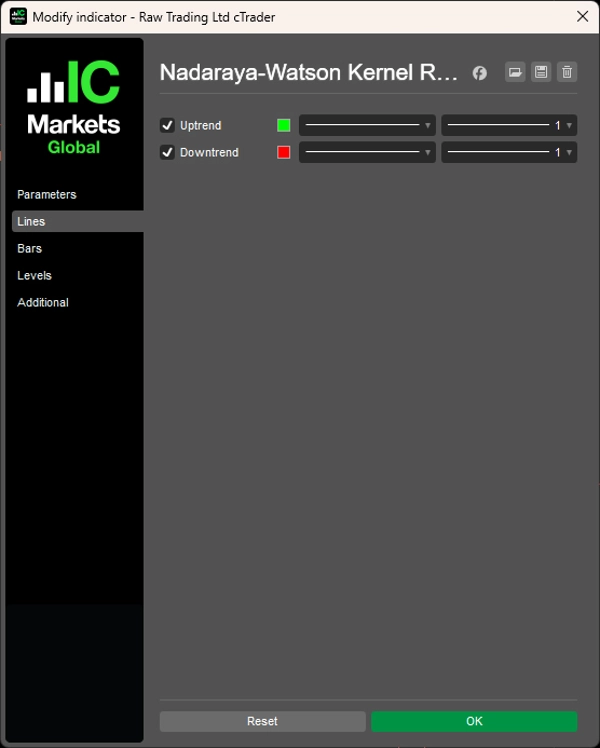
动态颜色编码
- 青柠色:上升趋势
- 红色:下降趋势
- 趋势方向的即时视觉确认
- 不连续线显示:颜色变化即时且视觉清晰
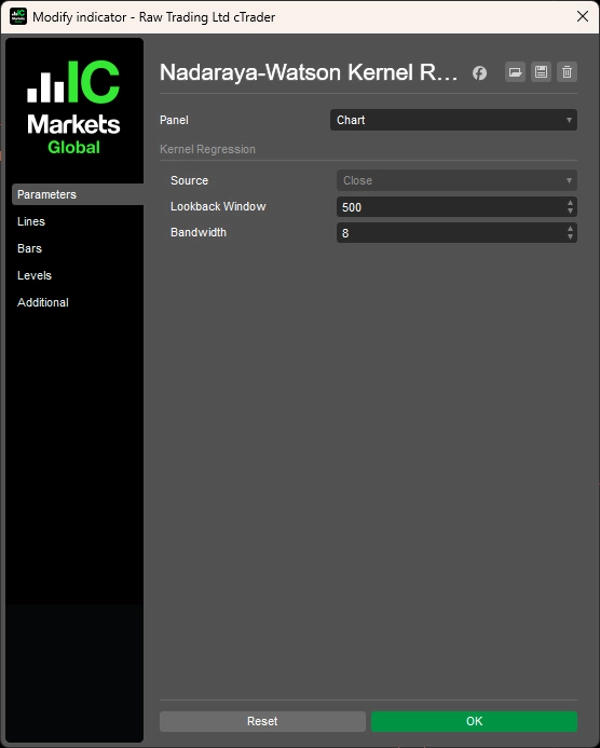
可调参数
- 带宽:微调响应性与平滑度的平衡
- 灵活的回溯窗口:50-2000根柱子,匹配您的时间框架
- 适应不同的市场条件和交易风格
简洁设计
- 双色,零杂乱——要么上升趋势,要么下降趋势
- 无噪声趋势识别
- 无需复杂设置
- 视觉简洁与数学精确相结合
__________________________________________________________________________________________
更多免费指标
探索各种市场分析工具——从结构和成交量到回归、波动率和自定义时间框架。
源代码可在GitHub 仓库获取。
全部免费使用。但如果您愿意支持喝咖啡,可以通过 这里捐助。
支撑/阻力
成交量
移动平均线
实用工具/自定义
基于回归
波动率
振荡器
__________________________________________________________________________________________
免责声明
交易存在风险。此指标仅用于技术分析——请始终应用适当的风险管理并负责任地交易。
反馈与改进
如果您有建议、功能请求或改进想法,请在讨论标签页留言。您的反馈有助于为所有人改进此指标。
摘要
AI 摘要
The Nadaraya-Watson Kernel Regression indicator provides an adaptive trend analysis tool using Gaussian kernel-weighted regression. It generates ultra-smooth trend lines by weighting nearby bars more heavily while distant bars fade exponentially, avoiding fixed-period lag typical of moving averages. This approach allows the indicator to automatically adjust to local price structures, delivering minimal lag and faster response to genuine trend changes.
Key features include dynamic color coding with lime indicating uptrends and red indicating downtrends, offering instant visual confirmation of trend direction through a noise-free, two-color design. Users can fine-tune the indicator’s responsiveness and smoothness via adjustable bandwidth and select a flexible lookback window ranging from 50 to 2000 bars to suit various timeframes and market conditions.
The indicator emphasizes mathematical precision and visual simplicity, requiring no complex settings. It is designed for traders seeking an adaptive smoothing method for trend identification without arbitrary period selection. This tool supports scalping strategies and is part of a broader suite of market analysis indicators focused on regression, volume, volatility, and custom timeframes.
指标配置
客户评价
5.0
评价:1
5 | 100 % | |
4 | 0 % | |
3 | 0 % | |
2 | 0 % | |
1 | 0 % |
客户评价
May 3, 2026
This indicator utilizes Gaussian kernel weighting to deliver mathematically superior smoothing. By fading distant data exponentially, it eliminates the lag of fixed-period averages while adapting to local price structure in real-time. A noise-free, two-color design provides instant trend clarity with institutional-grade precision. Ideal for traders seeking a responsive, high-fidelity trend filter.
讨论
常见问答
Scalping
cTrader Store 提供的所有产品,包括交易机器人、指标和插件,均由第三方开发者提供,仅供信息参考和技术访问之用。cTrader Store 并非经纪商,不提供投资建议、个人推荐或任何未来业绩保证。


价格
注册日期 20/12/2024
7.92K
免费安装