
说明
每日标准差水平 – 基于动态VWAP的标准差带
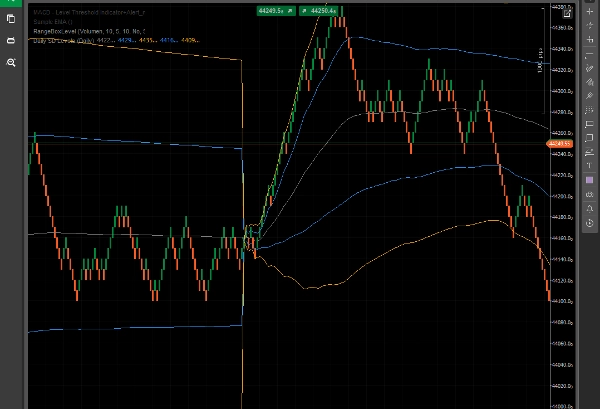
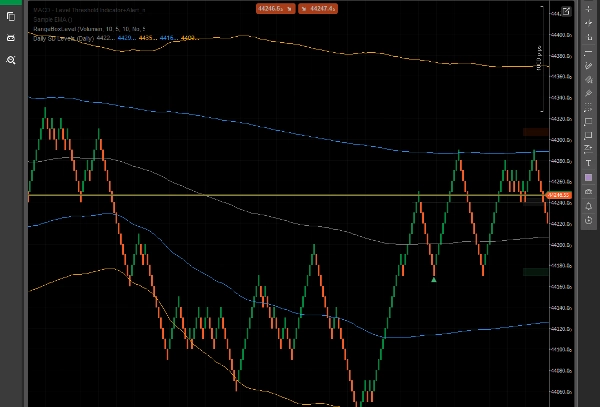
该每日标准差水平指标绘制了动态VWAP(成交量加权平均价)和标准差带(+1/+2和-1/-2),这些均基于当前交易日计算。
该工具帮助交易者直观评估日内波动性、潜在的支撑/阻力区域以及价格极值,所有这些均基于实际市场成交量和价格走势,而非固定或任意水平。
主要特点:
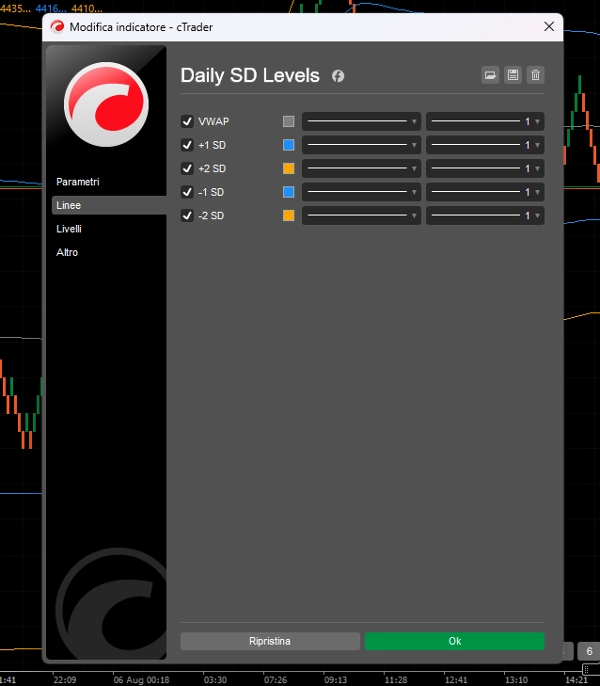
- VWAP线用于日内公允价值跟踪。
- +1/+2和-1/-2标准差带用于识别超买/超卖区域。
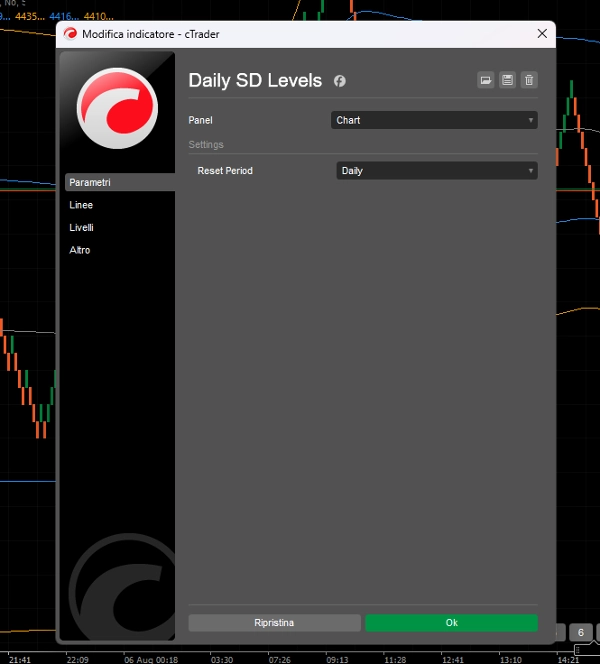
- 水平每日重置,适应每个交易时段的价格和成交量动态。
- 优化适用于Renko、区间柱和日内交易。
- 为需要清晰且动态价格区域的交易者打造。
该指标非常适合:
- 均值回归策略。
- 识别可能反转的过度拉伸走势。
- 对突破统计边界的视觉确认。
无杂乱。只有清晰、响应式的水平随市场动态移动。
摘要
指标配置
客户评价
5.0
评价:1
5 | 100 % | |
4 | 0 % | |
3 | 0 % | |
2 | 0 % | |
1 | 0 % |
客户评价
August 8, 2025
it gives context without making the decision, but the chart still needs a human read.
讨论
常见问答
cTrader Store 提供的所有产品,包括交易机器人、指标和插件,均由第三方开发者提供,仅供信息参考和技术访问之用。cTrader Store 并非经纪商,不提供投资建议、个人推荐或任何未来业绩保证。


价格
注册日期 16/07/2025
5
销售