

IPDA Data Range Dashboard
指标
版本 1.0, Aug 2026
Windows 版、Mac 版
5.0
评价:1

注册日期 07/05/2026
5
销售
63
免费安装
说明
IPDA 数据范围是 ICT 指导中最基础的概念之一——几乎每个版本的这个指标都有同样的缺陷:它使用你当前所在的时间框架来计算“天数”,所以一旦你不在日线图上,范围就会出错。
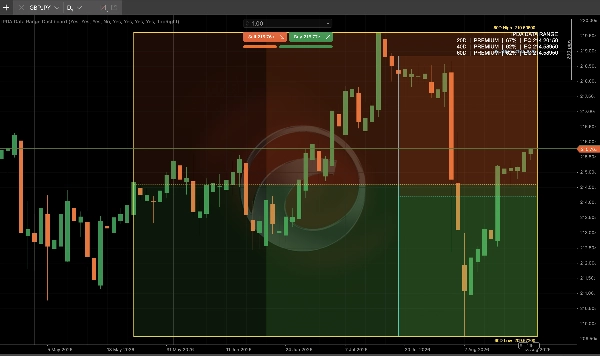
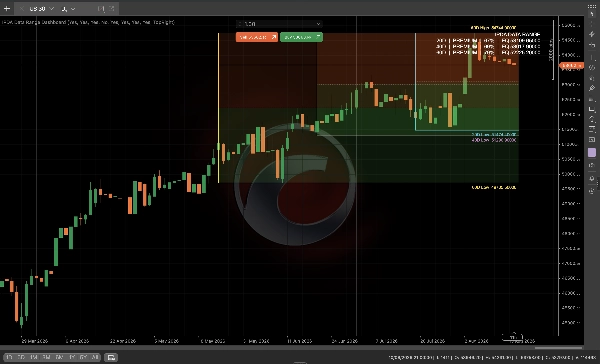
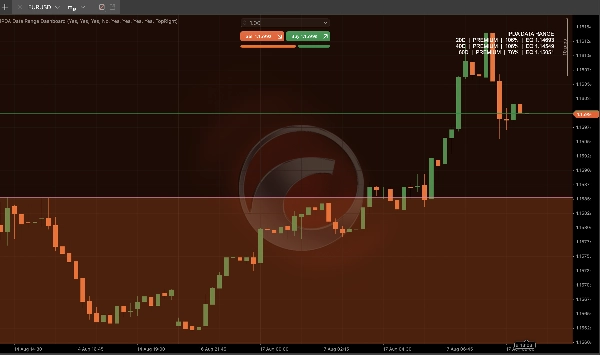
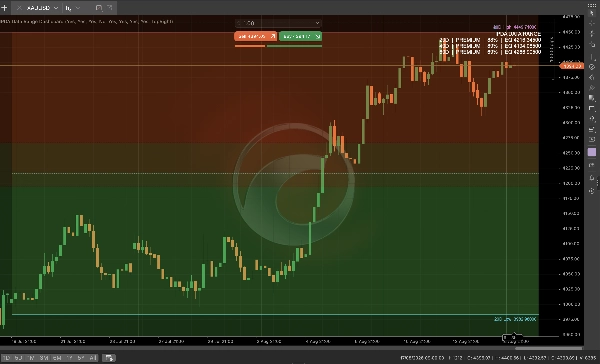
IPDA 数据范围仪表板解决了这个问题。它在后台将每个范围锚定到真实的日线蜡烛图,因此无论你是在交易4小时、15分钟还是日线,20/40/60天的机构回顾区间都是准确的。
你将获得:
- 20/40/60天的 IPDA 范围,每个都可独立切换
- 带有实时均衡线的溢价/折价阴影,适用于每个范围
- 季度变动标记——当价格收盘超出之前60天极值时的标志,是真正的机构区间扩展信号
- 实时仪表板面板,一目了然地显示每个范围的区域、仓位百分比和均衡价格
- 在任何图表时间框架上都完全准确——这是所有现有版本的核心缺口
专为运行高时间框架偏好模型的交易者打造,他们需要溢价/折价的背景信息,而无需每次都切换到日线图。只需一次附加,随时在你喜欢的任何时间框架上交易。
摘要
AI summary
The IPDA Data Range Dashboard is a trading indicator designed to provide accurate institutional price range analysis anchored to true daily candles. It calculates 20-, 40-, and 60-day IPDA lookback ranges independently of the chart timeframe, ensuring precision whether used on 15-minute, 4-hour, or daily charts. Key features include toggleable IPDA ranges, premium and discount zones with live equilibrium lines, and quarterly shift alerts that flag when price closes beyond prior 60-day extremes, indicating institutional range expansions. The dashboard panel displays each range’s zone, position percentage, and equilibrium price for quick reference. This tool addresses common inaccuracies in other IPDA indicators by maintaining consistent daily anchoring, making it suitable for traders employing higher-timeframe bias models who require premium/discount context without switching chart timeframes. The indicator supports visualization outputs and requires bar data for operation. It integrates concepts related to market structure such as breaker blocks, fair value gaps, breaks of structure, and support/resistance zones.
指标配置
指标分类
市场结构(SMC)
输出类型
可视化
信号
数据要求
仅 K 线
客户评价
5.0
评价:1
5 | 100 % | |
4 | 0 % | |
3 | 0 % | |
2 | 0 % | |
1 | 0 % |
客户评价
August 19, 2026
A focused and well-executed IPDA analysis tool. The 20/40/60-day ranges, Premium/Discount zones, equilibrium levels and dashboard worked consistently during testing. Most importantly, the same Daily-derived equilibrium values were maintained across M2, H1 and D1 charts, supporting the product's core multi-timeframe claim. The interface can become visually dense with all ranges enabled, but individual toggles make this manageable. Overall, a useful and stable higher-timeframe context tool.
讨论
常见问答
Breaker Block
Premium/Discount
Fair Value Gap
AI-assisted
BOS
Volume
Support & Resistance
cTrader Store 提供的所有产品,包括交易机器人、指标和插件,均由第三方开发者提供,仅供信息参考和技术访问之用。cTrader Store 并非经纪商,不提供投资建议、个人推荐或任何未来业绩保证。
该作者的其他作品














!["[Stellar Strategies] MARSI Signal Plotter" 标识](https://cdn.ctrader.com/image/webp/7b2b8da6-8f8e-4646-8d4a-4710c516c01e_25567)















价格
注册日期 07/05/2026
5
销售
63
免费安装