
说明
介绍 整合区 指标,旨在帮助您轻松识别并利用突破机会。
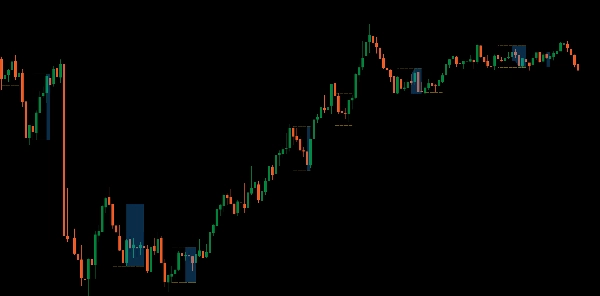
这个强大的工具会突出显示图表上价格整合的区域,使您能够轻松发现潜在的突破点。通过可视化这些关键区域,您可以更好地预测市场走势,做出更明智的交易决策。
非常适合希望通过清晰且可操作的见解提升策略的交易者,升级您的交易工具包,掌握突破技巧,使用整合区指标。
摘要
AI 摘要
The Consolidation Zones indicator identifies and visualizes price consolidation areas on trading charts to help traders spot potential breakout points. By highlighting these zones, it assists in anticipating market movements and supports more informed decision-making. This tool is applicable across multiple markets, including Forex, cryptocurrencies (e.g., BTCUSD), commodities (e.g., gold, oil), indices (e.g., NAS100, SP500), and stocks. It is designed to enhance trading strategies focused on breakout opportunities by providing clear visual cues of consolidation phases.
指标配置
客户评价
4.0
评价:1
5 | 0 % | |
4 | 100 % | |
3 | 0 % | |
2 | 0 % | |
1 | 0 % |
客户评价
October 12, 2025
Two timeframes give more context, and the log becomes easier to read.
讨论
常见问答
BTCUSD
Forex
Breakout
Indices
EURUSD
Commodities
GBPUSD
NZDUSD
Prop
Crypto
Stocks
XAUUSD
NAS100
USDJPY
cTrader Store 提供的所有产品,包括交易机器人、指标和插件,均由第三方开发者提供,仅供信息参考和技术访问之用。cTrader Store 并非经纪商,不提供投资建议、个人推荐或任何未来业绩保证。


猜您喜欢


价格
注册日期 25/09/2025
25
销售
315
免费安装