설명
틸슨 T3 이동평균선 (적응형 스무더)
개요:
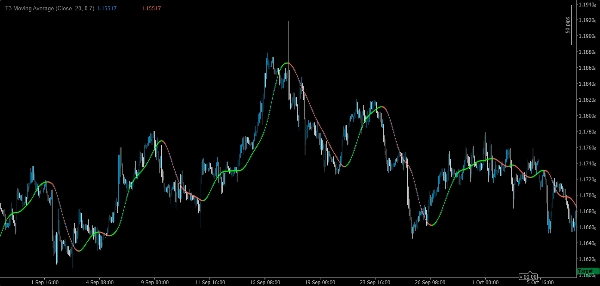
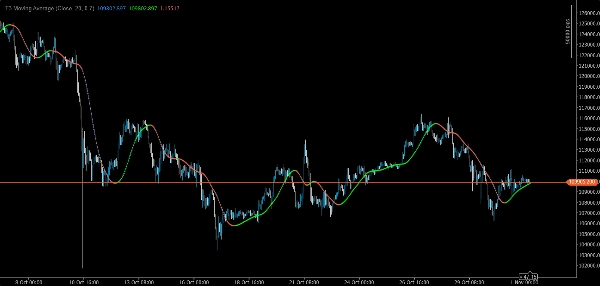
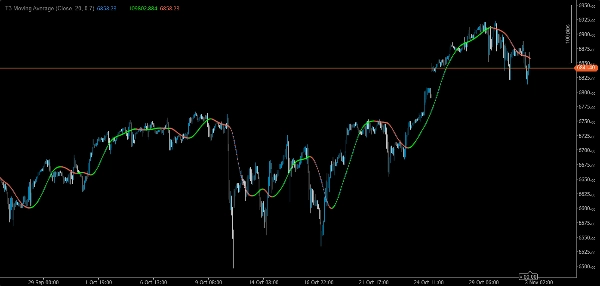
틸슨 T3는 최소한의 지연으로 탁월한 부드러움을 제공하도록 설계된 차세대 이동평균선입니다. 기존의 SMA나 EMA와 달리, T3는 조정 가능한 볼륨 팩터와 결합된 지수평균의 연쇄 적용을 통해 트레이더에게 유동적이면서도 반응성이 뛰어난 선을 제공합니다. 이는 추세 식별, 노이즈 필터링, 기타 지표의 부드럽게 만드는데 이상적입니다.
주요 특징:
• ⚡ 지연 감소: SMA/EMA보다 가격 변화에 더 빠르게 반응하면서도 휘핑 현상을 방지합니다.
• 🎯 초부드러운 곡선: 시장 노이즈를 걸러내어 추세 방향을 더 명확하게 합니다.
• 🔧 사용자 정의 가능한 볼륨 팩터: 반응성 대 부드러움 조절 가능 (0.3–0.9).
• 📊 시각적 명확성: 상승 및 하락 구간을 색상 코드된 점으로 강조 표시합니다.
• 🔄 다용도 활용: 단독 추세 필터, 트레일링 스톱의 기준선, RSI/MACD 같은 오실레이터의 스무더로 사용 가능.
• 🛠️ cTrader 최적화: 가볍고, 재도색 없음, 여러 타임프레임과 호환됩니다.
이 지표를 선택해야 하는 이유?
T3는 기술적 분석에서 가장 효과적인 스무딩 기법 중 하나로 널리 인정받고 있습니다. 트레이더가 수익성 있는 추세에 더 오래 머무르고, 변동성이 큰 시장에서 잘못된 신호를 피하며, 다양한 거래 스타일에 적응할 수 있도록 돕습니다. 스캘퍼, 스윙 트레이더, 시스템 개발자 모두에게 신뢰할 수 있는 우위를 제공합니다.
적합 대상:
• 저지연 추세 필터를 찾는 트레이더
• 맞춤 전략을 위한 모듈형 스무더가 필요한 개발자
• 표준 평균보다 뛰어난 전문 등급 지표를 원하는 모든 사람
요약
Key features include faster reaction to price changes while minimizing false signals, visual clarity through color-coded points indicating rising and falling phases, and versatile applications such as standalone trend filtering, baseline for trailing stops, or smoothing other oscillators like RSI and MACD. The indicator is optimized for the cTrader platform, ensuring lightweight performance, non-repainting behavior, and compatibility across multiple timeframes.
The T3 Moving Average supports a wide range of markets including forex pairs (EURUSD, GBPUSD), cryptocurrencies (BTCUSD), indices (NAS100, US 500), commodities (XAUUSD), and stocks. It is suitable for various trading styles, from scalping to swing trading, and for developers seeking a modular smoother for custom strategies.