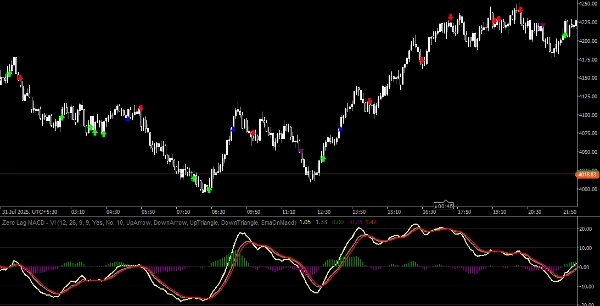
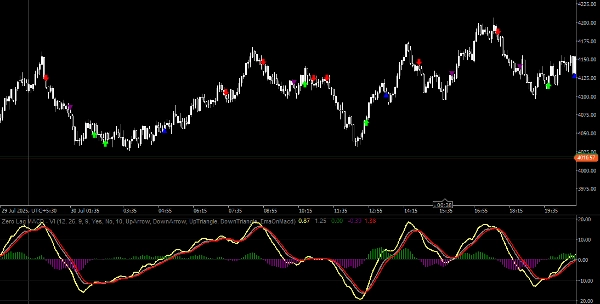
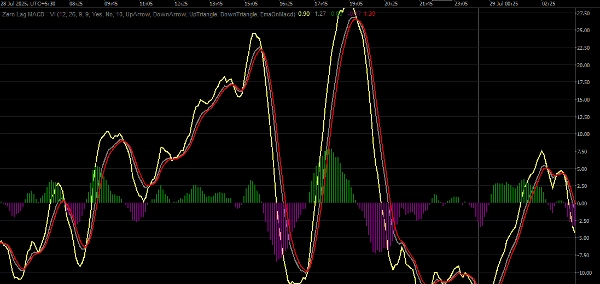
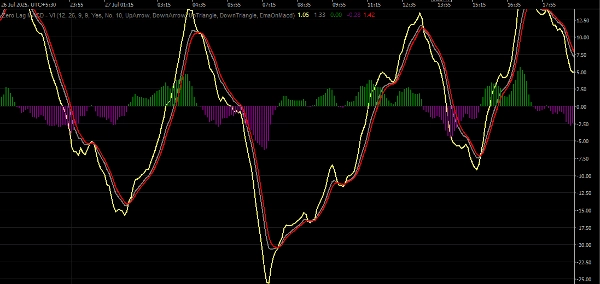
중개인 및 프랍
비즈니스용
00
Days
:
00
Hours
:
00
Minutes
:
00
Seconds
Zero Lag MACD
"Zero Lag MACD" 로고
가입일 14/03/2025
판매
12
"Zero Lag MACD" 업로드된 이미지"Zero Lag MACD" 업로드된 이미지"Zero Lag MACD" 업로드된 이미지"Zero Lag MACD" 업로드된 이미지

The Zero Lag MACD refines the classic MACD by applying smoothing techniques that drastically reduce indicator lag. This results in quicker identification of bullish and bearish momentum shifts, enabling Forex traders to enter and exit positions more precisely. It excels at spotting hidden and regular divergences, confirming trend strength, and filtering false signals in volatile currency pairs. By reacting faster to price changes without sacrificing smoothness, the Zero Lag MACD helps you seize high-probability opportunities and manage risk more effectively in fast-moving markets.

0.0
리뷰: 0
고객 리뷰
이 상품에 대한 리뷰가 아직 없습니다. 이미 사용해 보셨나요? 다른 사람들에게 가장 먼저 소개해 주세요!
이 작성자의 상품 더 보기
지표
Breakout
Signal
AI
Verve Ai Range Scalper
ICT Channel – Precision buy/sell signals , customizable settings , User-Friendly Interface
cBot
XAUUSD
Martingale
Commodities
+11
Quantum Martingale
AI-powered martingale trading bot with smart risk control and dynamic position scaling.
지표
NAS100
Indices
XAUUSD
+5
Gold Candle 100 Range
Dynamic, color‑coded candles reveal market shifts instantly—spot momentum and trend reversals at a glance
Multi Volume Profile
Advanced customizable volume-profile indicator with buy/sell levels, delta analysis, multi-TF support and vivid gradient
Trade Assistant Fx
Advanced forex trade panel for risk, margin, swaps, and trade control with precision tools.
지표
Indices
XAUUSD
Prop
+8
Dem
Scalping indicator for Renko 100 using EMAs to show trend and entry zones with clear colored rectangles.
좋아하실 만한 다른 항목
Zero Lag Exponential Moving Average
ZLEMA (Zero Lag EMA) is a faster, smoother version of EMA, ideal for capturing quick market shifts and trends.
지표
Grid
NAS100
NZDUSD
+18
Zig Zag ATR
ZigZag Pro — Advanced swing detection with ATR threshold, fractal confirmation, and colored segments. Clean market
지표
RSI
Indices
XAUUSD
+5
QQEX 2026 ULTRA
🚀 QQEX Trinity Indicator - The Ultimate Trading Filter 🚀
지표
NAS100
Breakout
XAUUSD
+14
Initial Range
Initial Range – Where the open writes the script.
지표
Stocks
Forex
Crypto
+1
Market Structure SNR + Auto Bias
Market Structure Indicator – Your Trading Map in a Noisy Market. No more Panicking Which one, Where, Why and How.
지표
NAS100
NZDUSD
XAUUSD
+14
WVAP-Bands Indicator_noSourceCode
VWAP with standard deviation bands. Fully customizable colors, periods, and multipliers for precise trading signals
지표
NAS100
NZDUSD
XAUUSD
+7
Bayesian Price Projection Model
Bayesian theory** to forecast a future price while providing **uncertainty ranges** that represent upper and lower bound
지표
NAS100
Breakout
XAUUSD
+12
VWAP & Sessions & D,W,M HLO Levels
Killzone Session With VWAP – Precision Meets Price Action
지표
NAS100
NZDUSD
Breakout
+12
Initial Balance Breakout Signals
📈 Initial Balance Breakout Signals: visually accurate IB levels, breakout alerts & forecast zones for smart trading.
지표
NAS100
NZDUSD
XAUUSD
+11
Session HighLow Pivot Points Indicator advanced version
Visualize global trading sessions with colored range boxes. Track New York, London, Tokyo, and Sydney sessions
E7 Harmonic Structures Basic
E7 Harmonic Structures Basic.
지표
NAS100
NZDUSD
Breakout
+16
Market Structure Pro
Auto-detect support and resistance & trendlines, highlight pullbacks/BOS retests, and filter with candle confirmation.
지표
Indices
AI
Machine Learning Momentum Index
The Machine Learning Momentum Index (MLMI) represents the next step in oscillator trading.
zh-cn Variety Period clock panel(multilanguage)
This indicator can be used to: change color, shape size, position, change font, increase or decrease, and other function
지표
NAS100
NZDUSD
Martingale
+26
MMXM Structure by Ludwig
MMXM Structure by LudwigICT – Professional Market Structure Mapping Tool
ICT Killzone and Sessions high_low
This indicator is an essential tool for traders seeking to visualize key trading sessions on their charts.
지표
Indices
XAUUSD
Commodities
+8
ATR on Chart
Plots the ATR on the chart for easy visualization.
Bars color 1
This is the first version I offer you for free.