
Описание
📈 PineScriptLabs Smart Signals CDRC [Авто TP/SL]
❓ Что это за индикатор?
Система Dynamic Close Range Channels (CDRC) — это индикатор, разработанный на основе теории PineScriptLabs, который использует два независимых канала для генерации сигналов на покупку/продажу 📊 и автоматического расчёта динамических целевых уровней прибыли (TP) и стоп-лосса (SL) 🎯, которые никогда не одинаковы.
🎯 Особый динамический алгоритм TP/SL ⚡
В отличие от систем с фиксированными уровнями или ATR, этот алгоритм рассчитывает TP и SL на основе фактического движения цены от последнего сигнала:
• Для LONG 📈: Измеряет расстояние от самой низкой зафиксированной цены до входа, вычисляет процент этого движения, и проецирует этот же процент вверх для установки целей
• Для SHORT 📉: Измеряет расстояние от самой высокой зафиксированной цены до входа, и проецирует этот процент вниз
🎯 Это означает, что каждая сделка имеет уникальные уровни, адаптированные к конкретному рыночному контексту в данный момент, отражая реальный импульс перед сигналом 💡
📊 Теория CDRC: построение каналов 🏗️
Техническая основа 🔍
Теория CDRC строит каналы исключительно на основе диапазонов цен закрытия, а не на волатильности или стандартном отклонении. Закрытия отражают реальный рыночный консенсус и устраняют шум от теней свечей 🎯
Процесс построения ⚙️
- Средняя цена: Среднее всех закрытий за период
- Диапазон: Разница между самым высоким и самым низким закрытием за период
- Амплитуда: Диапазон × Множитель ÷ 2
- Полосы:
o Верхняя = Средняя цена + Амплитуда ↗️
o Нижняя = Средняя цена - Амплитуда ↘️
🔄 Каналы пересчитываются на каждом баре, постоянно адаптируясь к рынку
⚙️ Как это работает?
Два одновременных канала 📊📊
• Канал 1 (Быстрый - 111 баров): Быстро реагирует на изменения, множитель 0.14 ⚡
• Канал 2 (Медленный - 388 баров): Долгосрочное видение, множитель 0.11 🐢
Генерация сигнала 🎯
• LONG ✅: Цена закрывается выше верхней полосы ОБАХ каналов в течение 2 последовательных баров 🟢
• SHORT ✅: Цена закрывается ниже нижней полосы ОБАХ каналов в течение 2 последовательных баров 🔴
🛡️ Двойное подтверждение фильтрует ложные сигналы
🤖 Автоматический расчёт TP/SL (детали алгоритма)
Для LONG 📈:
- Система непрерывно записывает самую низкую цену с момента последнего сигнала
- При генерации сигнала на покупку рассчитывает: Процент = (Вход - Минимум) / Вход × 100
- Проецирует этот процент вверх от входа для установки TP3
- Делит диапазон на три зоны: TP1 (33%), TP2 (66%), TP3 (100%)
- SL = Вход - (Вход × Процент × Коэффициент стоп-лосса / 100)
Для SHORT 📉:
- Система непрерывно записывает самую высокую цену с момента последнего сигнала
- При генерации сигнала на продажу рассчитывает: Процент = (Максимум - Вход) / Вход × 100
- Проецирует этот процент вниз от входа для установки TP3
- Делит диапазон на три прогрессивные зоны
- SL = Вход + (Вход × Процент × Коэффициент стоп-лосса / 100)
🎯 Результат: каждая сделка имеет уникальные уровни, рассчитанные в соответствии с конкретным рыночным импульсом в данный момент
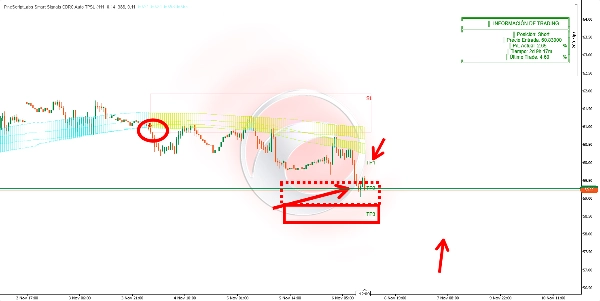
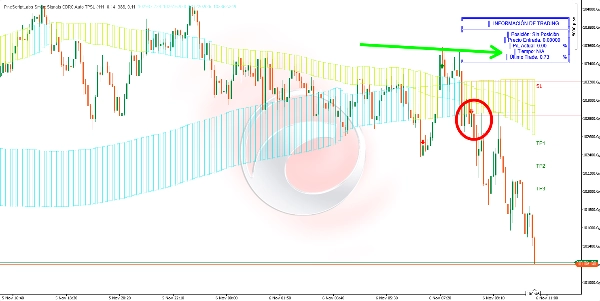
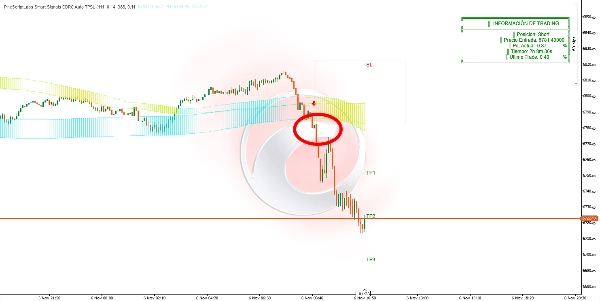
👀 Визуализация 🎨
• Точки: Полосы обоих каналов
• Динамическая заливка: Каналы меняют цвет при пробое
• Прямоугольники: Зона входа (SL-Вход) и три целевые зоны (прогрессивная прозрачность)
• Метки: SL, TP1, TP2, TP3 с точными ценами 🏷️
• Стрелки: Зелёные (покупка) 🟢 / Красные (продажа) 🔴
• Таблица: Текущая позиция, цена входа, текущая прибыль/убыток %, время в сделке, последняя закрытая сделка 📋
🎯 Для чего это нужно?
- Высоковероятные входы с двойным подтверждением на разных таймфреймах ✅
- Адаптивное автоматическое управление рисками на основе фактического движения рынка 🤖
- Уникальные ступенчатые цели для каждой сделки в соответствии с предыдущим импульсом 🎯
- Динамическая адаптация к недавнему поведению цены 🔄
- Мониторинг в реальном времени эффективности позиции 📊
🛠️ Как использовать?
Вход 🚀: Входить при закрытии бара, когда появляется стрелка
Управление 💼:
• TP1: 33% от проецируемого движения (частичная прибыль) 💰
• TP2: 66% движения (больше прибыли) 💰💰
• TP3: 100% движения (финальная цель) 🎯
• SL: Всегда соблюдайте автоматический стоп-лосс ⛔
Мониторинг 👀: Таблица показывает текущую прибыль/убыток в реальном времени. Система автоматически определяет достижение TP3 или SL. В одно время активен только один сигнал ⚠️
⚙️ Параметры и влияние
Период канала 1 (111):
• ↑ Больше баров = Меньше сигналов, надежнее, медленнее 🐢
• ↓ Меньше баров = Больше сигналов, быстрее, чувствительнее ⚡
Множитель канала 1 (0.14):
• ↑ Выше = Широкие полосы, меньше сигналов, только сильные движения 💪
• ↓ Ниже = Узкие полосы, больше сигналов, большая чувствительность 🎯
Период канала 2 (388):
• ↑ Выше = Строгое подтверждение, меньше сигналов 🛡️
• ↓ Ниже = Больше сигналов, меньше фильтрации 📊
Множитель канала 2 (0.11):
• ↑ Выше = Строгая фильтрация, консервативно 🎯
• ↓ Ниже = Более высокая чувствительность, больше сделок ⚡
Коэффициент стоп-лосса (50%):
• 50% = Соотношение 1:2 (профессиональный баланс: риск 1, прибыль 2) ⚖️
• ↑ К 100% = Широкий SL, больше риска, меньше срабатываний, хуже соотношение риск/прибыль 📉
• ↓ К 1% = Тесный SL, меньше риска, лучше соотношение риск/прибыль, больше срабатываний 📈
🔑 Ключевые моменты
• Память рынка 🧠: Записывает экстремумы цен с последнего сигнала для реалистичных и уникальных проекций
• TP/SL никогда не равны ⚖️: Каждая сделка имеет уровни, рассчитанные в соответствии с её конкретным контекстом
• Обязательное двойное подтверждение для 2 последовательных баров ✅✅
• В одно время активен только один сигнал ⚠️
• Каналы постоянно пересчитываются адаптируясь к рынку 🔄
• Прямоугольники визуально расширяются для поддержания видимости 👀
🚀 Более 10 000 трейдеров уже используют наши ТОП индикаторы🏆
👉 Получите все наши ТОП системы здесь:
_______________________________________________
📌 Индикаторы структуры рынка
· ✅ AdvancedMarket Structure: Bos, Choch, SwinLevels, Order Blocks, Market Structure& Liquidity Finder
· 🔄 Dynamic Market StructureAnalysis of Turning Points
· 🧱 Order Block
· ⚖️ Market Imbalance
· ⛓️ BOS & CHOCH
· 🧠 ICT Power of 3
_______________________________________________
🔚 Системы умного выхода
_______________________________________________
📐 Индикаторы ZigZag
· 🔍 ZigZag Price LiquidityProjection
· ➖ ZigZag
_______________________________________________
🧱 Индикаторы поддержки и сопротивления
· 🟩 SmartTrend Support &Resistance Lines
· 🧱 All Support and ResistanceLevels
_______________________________________________
📊 Индикаторы тренда и каналов
· 📊 Supertrend
_______________________________________________
💧 Инструменты объёма и ликвидности
_______________________________________________
⚡ Индикаторы импульса и RSI
· 🔎 Multi-Level Candle Bias
Tracker
_______________________________________________
🔮 Инструменты прогнозирования и проекции
· 📐 Прогноз на основе Linreg & ATR
· 📏 Fibonacci Linear Regression Multi-timeframe
· 📈 Volume-Powered Market Flow Projector
Сводка
Отзывы покупателей
5 | 67 % | |
4 | 0 % | |
3 | 33 % | |
2 | 0 % | |
1 | 0 % |


