Description
Impulse Matrix Pro 🚀
What Is It?
https://chartshots.spotware.com/c/69d5282dc32e0
Impulse Matrix Pro is an overlay indicator that generates buy and sell signals 📈📉 only when three independent engines agree simultaneously. It combines trend detection, impulse breakouts, and smart filters into a single confluent system with built-in risk management levels 🛡️.
https://chartshots.spotware.com/c/69d5293d873fa
The Three Engines ⚙️
https://chartshots.spotware.com/c/69d5288a347ea
Engine 1 — Trend (SMEMA) 🌊
A double-smoothed moving average (exponential → then simple) creates the Nexus Line.
- If it's rising → trend is bullish 🟢.
- If falling → bearish 🔴.
Around it, 3 envelope bands are drawn above and below, spaced by the smoothed average candle range. The price's position relative to these bands determines strength (0–3):
Strength
Meaning
1/3
Price beyond Band 1
2/3
Price beyond Band 2
3/3
Price beyond Band 3 ⚡
Higher minimum strength = fewer but higher-quality signals
Engine 2 — Impulse (BOSWaves)
Detects break-of-structure events using dynamic bands built from:
- An EMA baseline
- Mean Absolute Deviation (MAD) as the volatility unit
Key behavior: Bands contract after strong moves (easier to trigger) and expand during consolidation (harder to trigger). This is controlled by an impulse freshness score that decays over time ⏳.
- Bullish breakout: Previous close ≤ upper band, current close crosses above it 🚀.
- Bearish breakout: Previous close ≥ lower band, current close crosses below it 📉.
Engine 3 — Smart Filters 🛡️
Three gates every signal must pass:
- ATR Volatility: Market has enough movement to trade 🌊
- Momentum: Price is actually moving in the signal direction over N bars 🏃♂️
- Freshness: The impulse hasn't decayed — the move is still "alive" 🔥
Signal Conditions 🚦
BUY — All 7 must be true: ✅
- Nexus Line rising
- Bull strength ≥ minimum threshold
- Impulse bullish breakout detected
- Direction switched from bearish to bullish
- ATR filter passed
- Momentum confirms upward movement
- Impulse freshness above threshold
SELL — All 7 must be true: ✅
- Nexus Line falling
- Bear strength ≥ minimum threshold
- Impulse bearish breakout detected
- Direction switched from bullish to bearish
- ATR filter passed
- Momentum confirms downward movement
- Impulse freshness above threshold
Note: If any single condition fails → no signal ❌.
Stop Loss & Take Profit Logic 📏
All levels are ATR-based and fully adaptive to current volatility 🔄.
- Stop Loss distance = ATR × SL Multiplier (default 1.5)
Level
Calculation
Default R:R
SL
Entry ∓ (ATR × 1.5)
— 🛑
TP1
Entry ± (SL distance × 1.0)
1:1 🎯
TP2
Entry ± (SL distance × 2.0)
1:2 🎯🎯
TP3
Entry ± (SL distance × 3.0)
1:3 💰
Volatile markets → wider stops and targets. Quiet markets → tighter levels. Everything scales automatically ⚖️.
Visual Elements 🎨
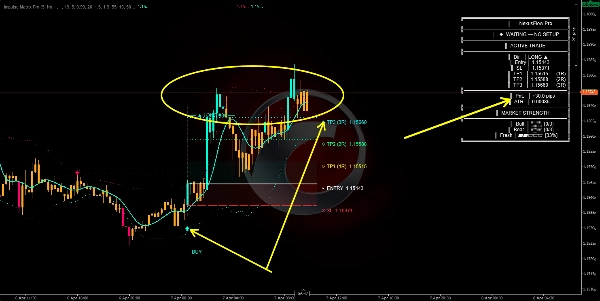
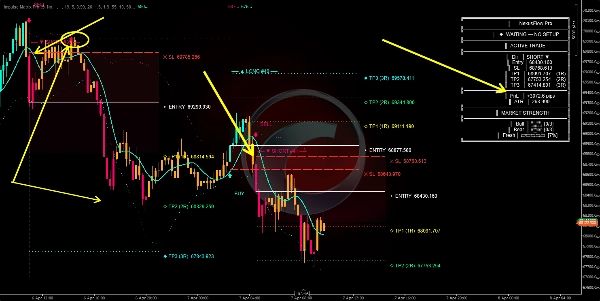
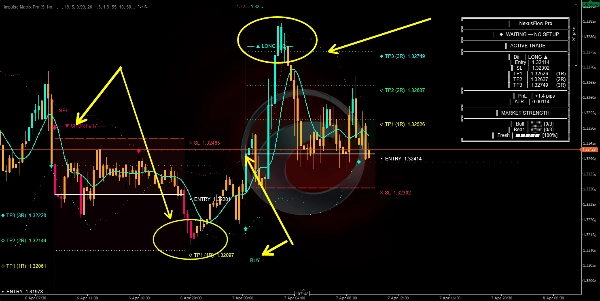
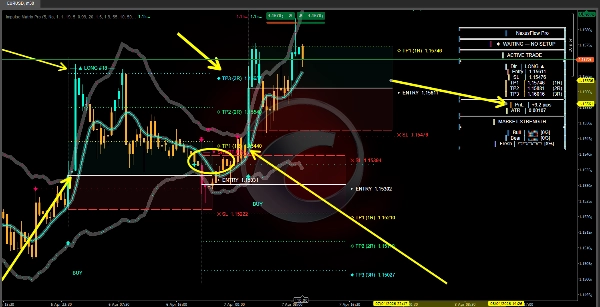
- Nexus Line: Central trend direction 🧵
- Envelope Bands: Strength measurement zones with gradient fill 📊
- Impulse Bands (dotted): Dynamic breakout thresholds 🏁
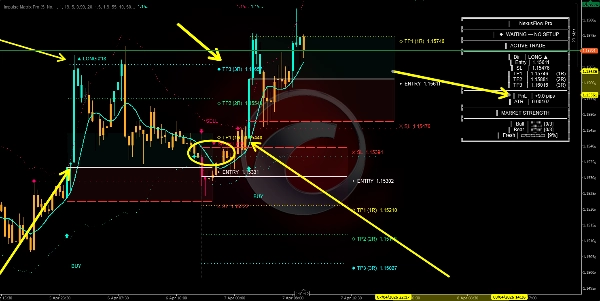
- BUY / SELL Arrows: Confirmed entry signals 🏹
- White Diamonds: Trend flip points on the Nexus Line 💎
- Entry / SL / TP Lines: Projected trade levels 📐
- Red Zone: Risk area (Entry to SL) ⚠️
- Green/Cyan Zone: Reward area (Entry to TP1) 🏆
- Stars + Horizontal Lines: Retest signals — price revisits impulse band without breaking it ⭐
- Trend Cloud: Subtle background shading showing dominant direction ☁️
- Bar Colors: Cyan = bullish · Pink = bearish · Orange = no setup 🎨
- Info Panel (top-right): Live trade data, PnL, strength meters, freshness gauge 🖥️
How To Use 📖
- Wait for a BUY/SELL arrow 🏹 — orange bars mean no setup, stay out 🛑.
- Check the panel 🖥️ — higher strength and freshness = higher conviction.
- Trade the projected levels 📏 — SL where marked, take partials at TP1/TP2, let the rest run to TP3.
- Retest stars ⭐ can be used as add-on opportunities to an existing position.
- Opposite signal 🔄 = previous trade is conceptually invalidated.
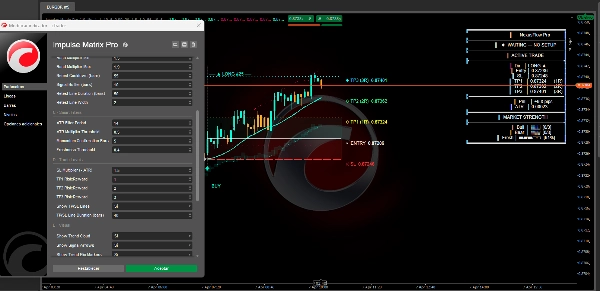
Key Parameters ⚙️
Parameter
Higher Value
Lower Value
Cycle Period
Smoother trend, slower signals
Faster, more reactive ⚡
Min Strength
Fewer signals, stricter filter
More signals, less filtering 🔍
Trend EMA Length
Smoother impulse baseline
More reactive breakouts 🌊
Band Multipliers
Wider impulse bands, fewer breaks
Narrower bands, more breaks 📏
ATR Threshold
Requires stronger volatility 🌪️
Allows low-volatility signals
Freshness Threshold
Only fresh impulses qualify 🔥
Allows decayed impulses
SL Multiplier
Wider stop loss 🛡️
Tighter stop loss 🎯
TP Ratios
More ambitious targets 💰
More conservative targets
Disclaimer ⚠️
This indicator does not execute trades. It is an analytical tool 🧠. TP/SL levels are volatility-based suggestions, not price guarantees. Performs best in trending conditions 📈. Combine with market structure analysis and proper risk management.
Summary
The three engines include:
1. Trend (SMEMA) – uses a double-smoothed moving average called the Nexus Line to determine bullish or bearish trends and measures price strength via three envelope bands.
2. Impulse (BOSWaves) – detects break-of-structure events using dynamic bands derived from an EMA baseline and volatility measured by Mean Absolute Deviation, with an impulse freshness score that decays over time.
3. Smart Filters – apply volatility, momentum, and freshness criteria to validate signals.
Signals require all seven conditions per direction (buy or sell) to be met, ensuring confirmation from trend, strength, breakout, momentum, and volatility filters. Stop loss and take profit levels are ATR-based and automatically adjust to market volatility, supporting risk management with multiple target ratios.
Visual elements include trend lines, envelope and impulse bands, entry/exit markers, zones indicating risk and reward, and an info panel displaying live trade data. The indicator supports markets such as Forex, indices, stocks, and cryptocurrencies. It is designed for trending conditions and serves as an analytical tool without executing trades.
Discussion
Customer reviews
5 | 100 % | |
4 | 0 % | |
3 | 0 % | |
2 | 0 % | |
1 | 0 % |