present
ลงทะเบียนและรับส่วนลด $50 สำหรับการซื้อครั้งแรกของคุณ
Trading product for Pivot Levels อินดิเคเตอร์ Fibonacci Fair Value Gap, image 1
Pivot Levels
อินดิเคเตอร์
เวอร์ชัน 1.1, Nov 2026
Windows, Mac
Trading product for Pivot Levels อินดิเคเตอร์ Fibonacci Fair Value Gap, image 2
1
ติดตั้งฟรี

คำอธิบาย

Pivot Levels: sessions, previous day and week, ORB, Floor Pivot and Camarilla

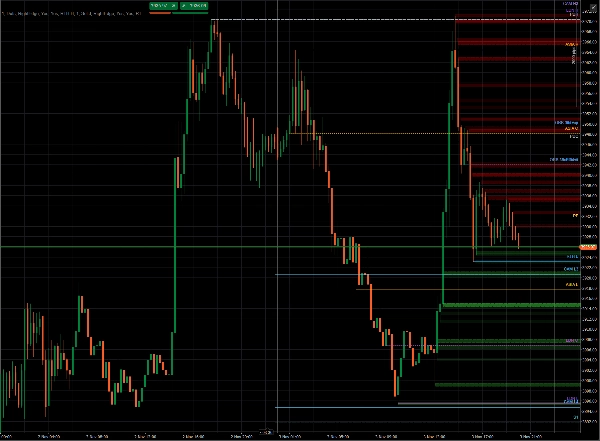
Pivot Levels puts the price levels that traders watch every day on your chart, drawn as clean rays with labels, and adds a compact table with the range of each session. It is a display-only study: it places no orders and changes nothing on your account.

What it draws

  • Today's sessions: Open, High and Low of the RTH session (09:30–16:00 New York), the Asian session (Tokyo) and the London session. Session times follow their own time zones, so daylight saving is handled for you, and you don't type any hours
  • Yesterday: Open, High, Low and Close of the previous trading day
  • Previous week: Open, High, Low and Close of the previous week.
  • Opening Range Breakout (ORB): the high ("up") and low ("down") reached in the first 15 and 30 minutes of the RTH session. Draw them only once the range has formed, or in real time while it forms
  • Floor Pivot: PP, R1, R2, S1, S2, calculated from the previous trading day
  • Camarilla: H3, H4, H5, L3, L4, L5, calculated from the previous trading day

Each line starts where its value was formed (the time of the high, the low or the open), so you can see when a level was set. Current levels extend to the right as rays. Past days can optionally be shown for review.


Session Range Monitor

A small table shows, for each session of the current trading day, its range in points and pips and an arrow for the direction of the session. The live session is highlighted. You choose the corner, the offsets and the font size.


Trading day without setup

By default the trading day is taken from your broker's own Daily bars, so rollover and daylight saving are the real ones for your server and nothing needs to be configured.

Alternatively you can use a fixed 17:00 New York day, identical across brokers. You can also compute yesterday, weekly and pivot levels on the full session or on RTH only.


Customization

  • Every level has its own switch, label, line width, line style, color (with the native color picker), label side and optional price value
  • Label position: left, right (follows the last bar), or anchored to the right or left edge of the chart, next to the Y axis, even while you scroll or zoom
  • A general switch to show labels only, or labels with values, and a label font size
  • History loads in the background, so the chart stays responsive. The data timeframe is chosen automatically from your chart and can be changed


Good to know

  • Works on any symbol and chart timeframe supported by your CFD broker's data since all levels are derived from price only
  • Levels are calculated from the data your broker provides, so values can differ slightly between brokers
  • This is an analysis tool, not trading advice. Past levels do not guarantee future price behavior


สรุป

โปรไฟล์อินดิเคเตอร์
หมวดหมู่อินดิเคเตอร์
แนวรับและแนวต้าน
ประเภทเอาต์พุต
การแสดงเป็นภาพ
ข้อกำหนดด้านข้อมูล
แท่งเท่านั้น
สัญญาณที่รองรับ
Breakout
Reversal
ความแข็งแกร่งของแนวโน้ม
ความผันผวน
แตะ Level ที่ระบุ
เบรก Level ที่ระบุ
Range ณ เวลาที่เปิดเซสชัน
Divergence
Cross

การสนทนา

รีวิวจากลูกค้า

0.0
รีวิว: 0
รีวิวจากลูกค้า
ยังไม่มีรีวิวสำหรับผลิตภัณฑ์นี้ หากเคยลองแล้ว ขอเชิญมาเป็นคนแรกที่บอกคนอื่น!

คำถามที่พบบ่อย

Fibonacci
Fair Value Gap
Key Levels
Order Block
Market Structure
Supply & Demand
Support & Resistance
ผลิตภัณฑ์ที่มีให้บริการผ่าน cTrader Store รวมถึงบอทการเทรด อินดิเคเตอร์ และปลั๊กอิน มีให้บริการโดยนักพัฒนาบุคคลที่สามและมีไว้เพื่อวัตถุประสงค์ในการเข้าถึงข้อมูลและทางเทคนิคเท่านั้น cTrader Store ไม่ใช่โบรกเกอร์และไม่ได้ให้คำแนะนำการลงทุน คำแนะนำส่วนบุคคล หรือการรับประกันผลการดำเนินงานในอนาคต

เพิ่มเติมจากผู้เขียนคนนี้

อินดิเคเตอร์
Fibonacci
Key Levels
+5
Displays the swing level zones shared by Flex Renko Inverse on any timeframe chart. Requires Flex Renko Inverse
"Flex Renko Inverse" โลโก้
เรตติ้งสูง
4.2
(4)
$99
อินดิเคเตอร์
Pin Bar
Order Block
+5
NEVER MISS A TREND & LET TRENDS RUN with Sierra Chart's Flex Renko Inverse, rebuilt for cTrader.

นอกจากนี้คุณยังอาจชอบ

อินดิเคเตอร์
ATR
EMA
+5
Candle timer with live profit tracking on chart – displays pips, currency value, and percentage in real time.
อินดิเคเตอร์
Bollinger
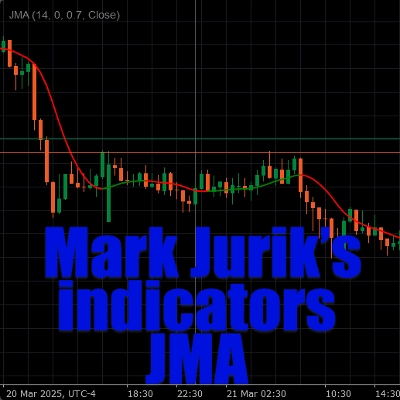
Jurik Moving Average (Jurik's Moving Average) triple adaptive filter with unique Jurik smoothing and dynamic factor.
"Half Trend Cloud BT" โลโก้
ยอดนิยม
4.5
(2)
$40
/
$80
อินดิเคเตอร์
Prop
Forex
+12
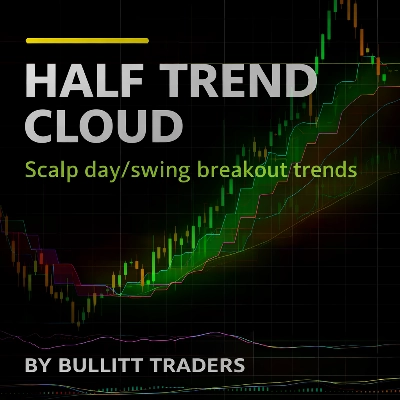
Half Trend Cloud
อินดิเคเตอร์
SMC
Forex
+5
Detects Break of Structure (BOS) and Change of Character (CHOCH)
"ProVWAP" โลโก้
ยอดนิยม
4.4
(5)
$19
/
$20
อินดิเคเตอร์
ATR
RSI
+5
Advanced Anchored VWAP for cTrader: volatility bands, real‑time alerts & customizable session resets.
อินดิเคเตอร์
SMC
Forex
+5
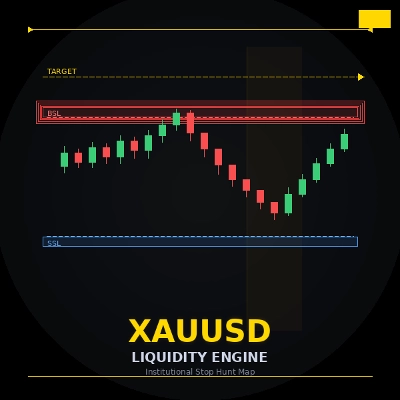
ICT liquidity engine for Gold: maps stop clusters, scores zones & projects the next target. Now with 4 ICT killzones.
อินดิเคเตอร์
Crypto
Signal
+3
Candlestick Signal Finder: cTrader indicator that automatically detects and color-codes key Japanese candlestick pattern
"[CB] Pivot Points Pro" โลโก้
ยอดนิยม
4.3
(3)
$19
/
$20
อินดิเคเตอร์
Indices
Breakout
+1
You can use the cTrader Pivot Points Pro indicator to find a good pullback entry in a trend
อินดิเคเตอร์
Key Levels
Liquidity Grab
+2
The levels you mark each morning, drawn and followed: PDH/PDL, weekly, monthly, sessions, equal highs/lows.
อินดิเคเตอร์
ATR
BOS
+5
Market structure with BOS and CHoCH, order blocks, and retest buy/sell arrows with entry, stop and two targets
"Smart Money Gaps" โลโก้
ยอดนิยม
4.6
(5)
$20
/
$40
อินดิเคเตอร์
AI
ATR
+27
Smart Money Gaps: MTF FVG auto-detection, extension, and mitigation marker. Trade institutional imbalances.
อินดิเคเตอร์
ATR
MSS
+5
Advanced market structure and institutional cycle mapper with visual reference cards and entry alerts
"Renko Bands Pro" โลโก้
ยอดนิยม
4.6
(6)
$19
/
$29
อินดิเคเตอร์
ATR
Key Levels
It combines the trend-filtering power of Renko charts with the volatility tracking of ATR Bands
อินดิเคเตอร์
AI
SMC
+4
Weekly Daily Opening Gaps — NWOG & NDOG Indicator Professional-grade opening gap visualization for institutional traders
"Supertrend" โลโก้
ยอดนิยม
4.3
(3)
$19
อินดิเคเตอร์
ATR
RSI
+6
💹 Define a price channel 📈 and determine trend direction (bullish 🟢 or bearish 🔴).
"Supertrend Indicator v1.1" โลโก้
ยอดนิยม
4.5
(4)
$19
/
$30
อินดิเคเตอร์
AI
ATR
+27
Supertrend Indicator
อินดิเคเตอร์
Order Block
Breaker Block
+5
Unicorn Model ICT Indicator — Smart Trading with Precision
อินดิเคเตอร์
RSI
VegaXLR's cTrader StochRSI identifies overbought/oversold RSI levels for precise trade entries.

ราคา

1
ติดตั้งฟรี