present
Sign up and get $50 off your first purchase
Trading product for Dynamic swing levels reader Indicator Fibonacci Fair Value Gap, image 1
Dynamic swing levels reader
Indicator
1 downloads
Version 1.1, Nov 2026
Windows, Mac
Trading product for Dynamic swing levels reader Indicator Fibonacci Fair Value Gap, image 2
1
Free installs

Description

Dynamic Swing Levels Reader - the companion to Flex Renko Inverse

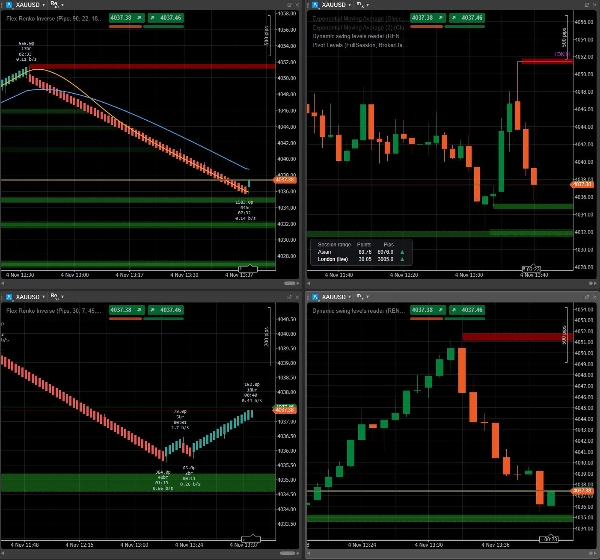
Flex Renko charts are excellent for spotting where the market really turned. Most traders, though, still execute on regular timeframe charts: M1, M5, H1. Dynamic Swing Levels Reader connects the two. It takes the swing zones from a Flex Renko Inverse chart and draws them, live, on any timeframe chart of the same symbol.


What "Requires Flex Renko Inverse" means

This indicator does not calculate anything by itself. It is a reader. The zones are created by Flex Renko Inverse, our main study, which builds renko bricks tick by tick and marks every confirmed reversal as a swing zone. Zones that price has not yet come back to are shared, and the Reader displays exactly those.

Without Flex Renko Inverse running on one of your charts, the Reader has nothing to show. That is why it is free: it extends the main study, it does not replace it.


How it works

  1. Open a Flex Renko Inverse chart and give it a name in "Instance name" (for example RENKO_CONTEXT)
  2. On any timeframe chart of the same symbol, add Dynamic Swing Levels Reader and type the same name in "Read swing levels from"
  3. That's it. The zones appear and stay in sync. When price reaches a zone it disappears from both charts, and new zones show up as soon as the renko chart creates them

Both charts must be open in cTrader on the same computer. If something is not connected (wrong name, different symbol, renko chart closed), the indicator tells you on the chart what is missing.


Why get Flex Renko Inverse

The swing zones are just one of its features. Flex Renko Inverse gives you:

  • Renko bricks built from real ticks, never from aggregated bars, with separate settings for trend continuation and reversal. Closed bricks never repaint
  • Swing zones with strength: the bigger the move that started from a turning point, the more visible its zone
  • Leg labels with the size, number of bricks, duration and speed of every swing, plus an arrow when the current leg is moving faster than usual
  • A rotation dashboard that shows, across 1, 5, 15 and 30 minutes, whether swings are getting wider or narrower and which side is in control
  • Moving averages calculated on bricks, not on hidden candles
  • The real time of every brick under your cursor

Use a slower renko as your context, share its zones, and trade them on the timeframe you are used to.


👉 Get Flex Renko Inverse: https://ctrader.com/products/5546

Summary

AI summary
Dynamic Swing Levels Reader is an indicator designed to display swing level zones generated by the Flex Renko Inverse study on any timeframe chart within cTrader. It functions as a companion tool that reads and visualizes swing zones created by Flex Renko Inverse, which builds Renko bricks tick-by-tick and identifies confirmed reversals as swing zones. These zones are shared live and synchronized between the Flex Renko Inverse chart and any other chart of the same symbol, allowing traders to view Renko-based swing levels on their preferred timeframe charts (e.g., M1, M5, H1).

To use it, a Flex Renko Inverse chart must be open and named; the Dynamic Swing Levels Reader then references this name to display the corresponding swing zones. Zones disappear once price revisits them, and new zones appear as the Renko chart updates. Both charts must be open simultaneously on the same computer.

Flex Renko Inverse offers advanced features including real-tick Renko bricks with separate trend and reversal settings, swing zones weighted by move strength, detailed leg metrics (size, duration, speed), a multi-timeframe rotation dashboard, and moving averages calculated on bricks. This setup enables traders to use slower Renko charts for market context while executing trades on their usual timeframe charts.

Indicator profile
Indicator category
Support & resistance
Output type
Visualisation
Data requirements
Bars only
External data
Supported signals
Cross
Divergence
Breakout
Reversal
Trend strength
Volatility
Level touch
Level break

Discussion

Customer reviews

0.0
Reviews: 0
Customer reviews
No reviews for this product yet. Already tried it? Be the first to tell others!

FAQ

Fibonacci
Fair Value Gap
Key Levels
Order Block
Market Structure
Supply & Demand
Support & Resistance
Products available through cTrader Store, including trading bots, indicators and plugins, are provided by third-party developers and made available for informational and technical access purposes only. cTrader Store is not a broker and does not provide investment advice, personal recommendations or any guarantee of future performance.

More from this author

Indicator
Pin Bar
Order Block
+5
NEVER MISS A TREND & LET TRENDS RUN with Sierra Chart's Flex Renko Inverse, rebuilt for cTrader.
Indicator
Fibonacci
Key Levels
+5
Draws RTH, Asian, London, prior day/week, ORB, Floor and Camarilla pivot levels as rays, with a session range table.

You may also like

Indicator
RSI
VWAP
+5
Trend direction, chart signals, reversal zones and volume tools in one configurable indicator.
Indicator
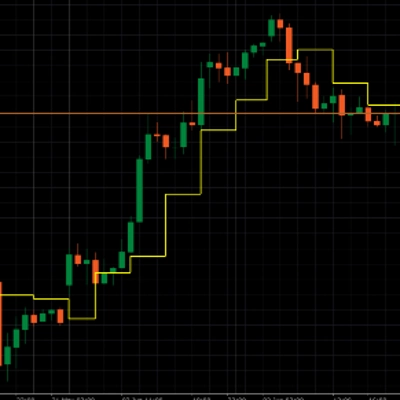
It draws a step line that visualize the movement of H4. Particularly effective when trade on lower timeframe.
Indicator
BOS
MSS
+3
identify Market Structure Breaks and Order Blocks to trade with confidence and avoid fake breakouts.
Indicator
ATR
Volume
+2
Nine timeframe cards, vivid candles, native BUY/SELL arrows and adjustable ATR-buffer stop-loss reference lines.
Indicator
Pin Bar
Inside Bar
+2
Advanced candlestick pattern recognition with structural quality scoring, alerts and adaptive chart visuals.
Indicator
Prop
Forex
+13
Supertrend - Multi-Timeframe Indicator
Indicator
Key Levels
Support & Resistance
Add your provider's gamma levels by hand or automatically with our feed plugin, and see the gamma regime at a glance.
Indicator
EMA
Outlines the first candle of the real session open for indices, forex & crypto. Auto DST, HTF candle panel & EMA.
Indicator
Color-Based Market Pressure & Volatility Visualizer The Kandika Heatmap Indicator
Indicator
SMC
Forex
+5
Silver Bullet by LudwigICT
Indicator
Prop
Forex
+5
🎯 Order Block Detector - Smart Trading: Identifica bloques de órdenes clave en cTrader para un trading más inteligente.
Indicator
Fair Value Gap
Liquidity Grab
+2
PRO Liquidity Sweep + FVG Combo detector with custom Gold/Blue signals & alerts
Indicator
ATR
SMC
+18
Super Wick detects powerful candle rejections: fractal long-wicks, HTF resonance zones, and a WSI gauge.
Indicator
Allow trader to draw multi trendlines in different timeframes on one chart,Give trader an overview of the current market
Indicator
RSI
Indicator Stochastic With RSI
Indicator
ATR
MSS
+3
Stop drawing levels manually. SmartLevels Pro detects, scores & predicts — H4/H1/M15 · cTrader
Indicator
SMC
VWAP
+5
Smart ICT Concepts indicator from TV: combining FVGs, Liquidity, Order Blocks, and Market Structure in one tool.
Indicator
Market Structure
Stop guessing which trading session you in, with Sessions indicator sessions are in your finger tips like a pro

Price

1
Free installs