

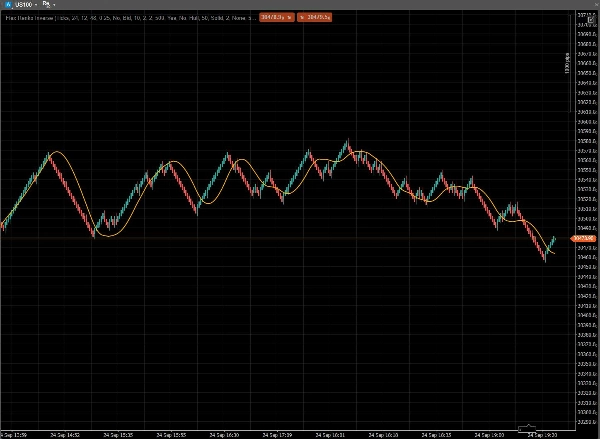
Description
You already know the bar that does this. You just can't get it on cTrader.
If you have ever traded Flex Renko Inverse bars or NinzaRenko bars on other trading platforms, where the idea started, you know what happens the first time you put them on a chart. The noise stops. A trend that was fifteen candles of doubt becomes one long brick that simply keeps going. And the bar that ends it is unmistakable, because it can only print when price has moved far enough that something has genuinely changed.
Then you open cTrader and it isn't there. Not in the platform. Not in the store.
That is the entire reason I decided to develop this tool.
What actually makes these bricks different
A standard Renko brick treats both directions the same: move N, print a brick, either way.
That symmetry is exactly why it shakes you out. A pullback that means nothing looks identical to a reversal that means everything.
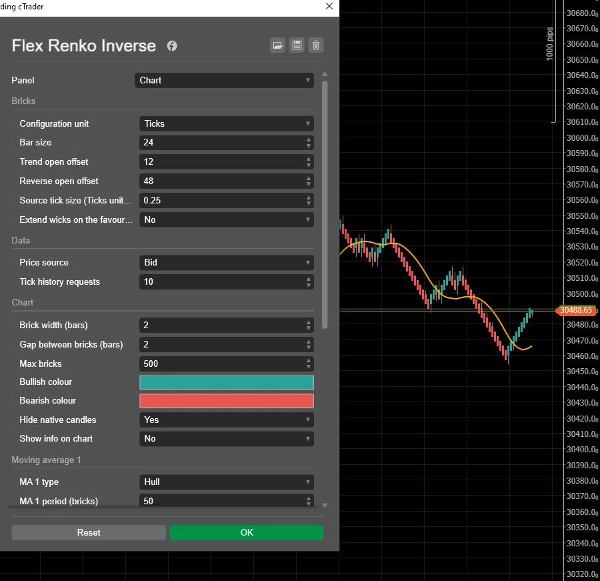
Flex Renko Inverse breaks the symmetry on purpose, with three numbers:
- Bar size - how tall every brick is. Always exactly this. No exceptions
- Trend open offset - how little price has to travel in your direction to extend the trend. Continuation is made cheap
- Reverse open offset - how far price has to travel against you before a reversal brick is allowed to print. Reversal is made expensive
Set it to 8-4-16 and continuation costs 4 ticks while reversal costs 20. Your trend survives every pullback that isn't a real one, and when the reversal brick finally appears, it appears with its full wick already measured, telling you exactly how much the market gave back to earn it.
That asymmetry is the whole edge of the bar type. It is why traders who have used it don't go back.
The trend channel preset nobody expects
Set the triplet to 8-7-1 and the chart changes character completely: a channel of stacked bricks that tracks the trend one tick at a time and flips the instant momentum does. It is the configuration Sierra users trade the open with, and it is included.
What you get
- Faithful geometry: fixed-level model, strict triggers, constructed reversal wicks, the same rules as the original, documented line by line and guarded by 69 automated tests
- Tick by tick: bricks are built from the real tick stream, never from aggregated candles. That is the only way the levels can be honest
- Any instrument: configure in ticks or pips, with a source tick size so a Sierra preset written, for example, for NQ transfers to your broker's US100 without silently changing meaning
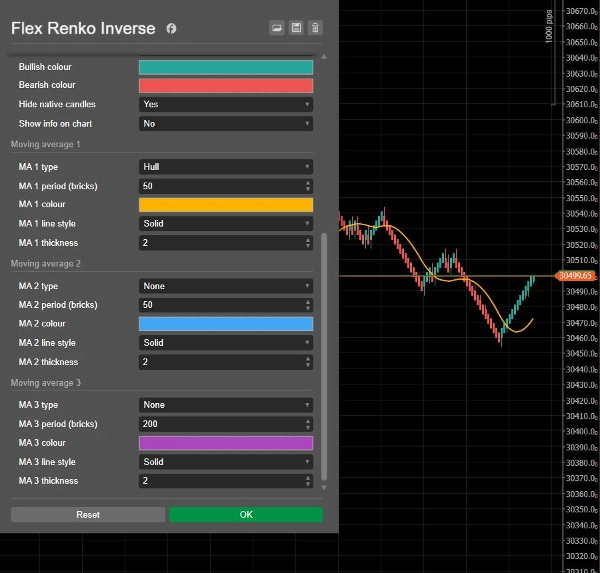
- Three moving averages built in: Simple, Exponential and Hull, with their period counted in bricks, not in chart bars. A 20-period average means twenty bricks, always. Colour, line style and thickness are yours.
- Your colours: native colour pickers for bullish bricks, bearish bricks and every average
- Open to your own code: the brick model is a public API: a cBot or another indicator can read the full history, subscribe to closes, and trade the bricks directly
What it will not do
It will not repaint your history. A closed brick is immutable, it cannot move, change size, or disappear. The forming brick does update as price moves, because an outcome that hasn't happened yet cannot be pretended into certainty. Every serious real-time bar
type works this way, and this one tells you which brick is still undecided instead of hiding it.
It will not place trades for you, and it makes no claim about your results. It draws the bars correctly. What you do with them is the part only you can do.
Start here
Load it, set 8-4-16 or 16-8-32, and watch one session you already traded today. You will recognise the moment the noise disappears and the moment the reversal brick prints, right where you felt it but couldn't see it.
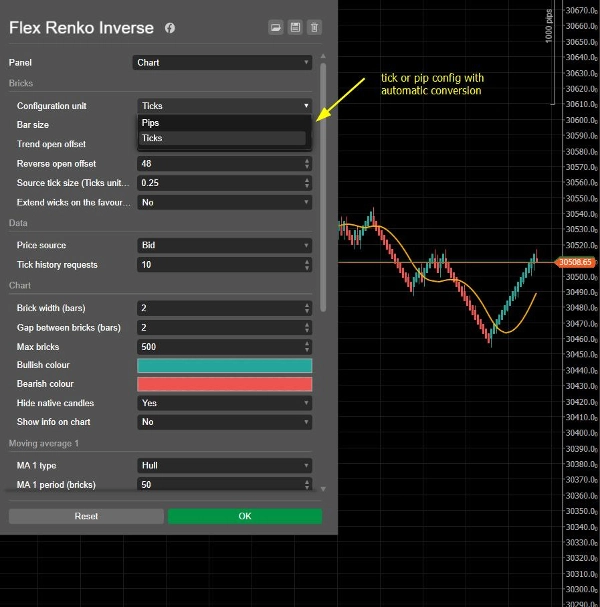
Automatic conversion from ticks to pips
Configure your triplets in ticks if you're coming from futures, and the study will automatically convert them to pips. Or, if you already have a good triplet in pips, simply configure it directly in pips.














!["Wyckoff Toolkit [Iridio Capital]" logo](https://cdn.ctrader.com/image/webp/5318c788-91ef-4297-bca6-4ce73b1516a8_61556)

