
Weekly Daily Levels
อินดิเคเตอร์
2 การซื้อ
เวอร์ชัน 1.0, Aug 2025
Windows, Mac
5.0
รีวิว: 2
คำอธิบาย
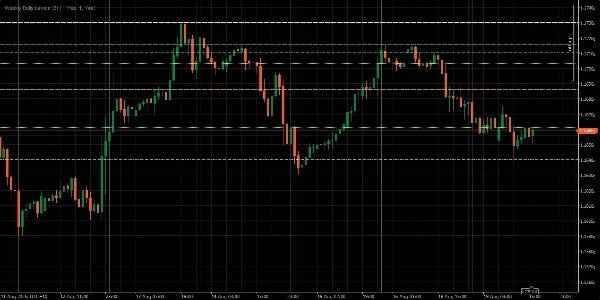
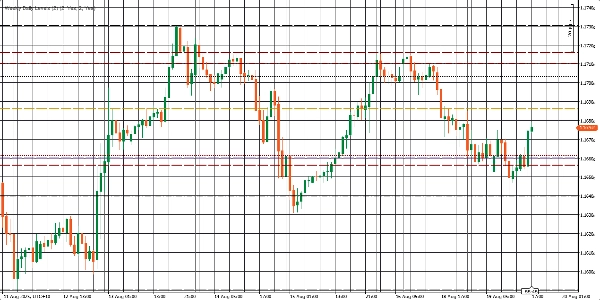
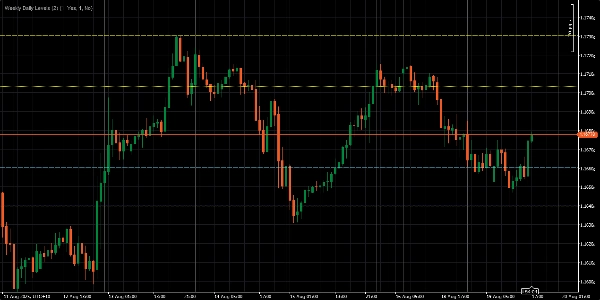
คุณพึ่งพาราคาปิดเปิดสูงต่ำ (OHLC) รายวันและรายสัปดาห์ รวมถึงราคากลางในกลยุทธ์การเทรดของคุณหรือไม่? เบื่อกับการทำเครื่องหมายด้วยตนเองทุกครั้งที่คุณทำการเทรดหรือเปล่า?
ตัว Weekly Daily Levels Indicator จะช่วยทำงานหนักให้คุณโดยอัตโนมัติ มันจะวางราคาปิดเปิดสูงต่ำ (OHLC) และราคากลางของวันก่อนหน้าและสัปดาห์ก่อนหน้าโดยตรงบนกราฟของคุณ ซึ่งหมายความว่าคุณสามารถมุ่งเน้นไปที่การดำเนินกลยุทธ์ของคุณในขณะที่ตัวบ่งชี้ดูแลรายละเอียด—ทำให้การเทรดของคุณง่ายขึ้น เร็วขึ้น และมีประสิทธิภาพมากขึ้น
คุณสมบัติหลัก:
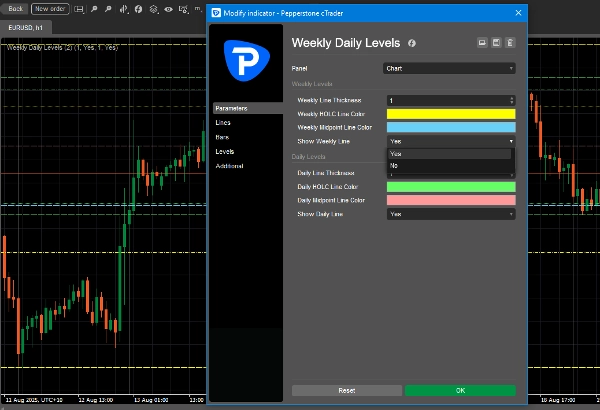
- แสดงราคาปิดเปิดสูงต่ำ (OHLC) และราคากลางรายวันและรายสัปดาห์ทันที
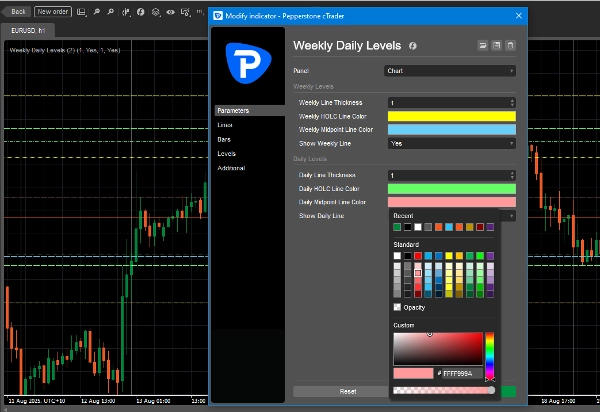
- ปรับแต่งสีเส้นให้เข้ากับสไตล์กราฟของคุณ
- เปิดหรือปิดระดับรายวันหรือรายสัปดาห์ได้ด้วยคลิกเดียว
- ปรับความหนาของเส้นเพื่อการมองเห็นที่ดีขึ้น
สรุป
สรุปโดย AI
The Weekly Daily Levels indicator automatically plots the previous day’s and previous week’s open, high, low, close (OHLC) prices along with their mid-points directly on trading charts. It provides instant visual reference to these key price levels, helping traders incorporate daily and weekly price data into their strategies without manual marking. Users can customize line colors and thickness to fit their chart style and toggle daily or weekly levels on or off with a single click. This indicator streamlines the process of tracking important historical price levels for improved trading efficiency.
โปรไฟล์อินดิเคเตอร์
รีวิวจากลูกค้า
5.0
รีวิว: 2
5 | 100 % | |
4 | 0 % | |
3 | 0 % | |
2 | 0 % | |
1 | 0 % |
รีวิวจากลูกค้า
August 28, 2025
Not bad if the rules are already clear. Two timeframes give more context.
August 21, 2025
the good surprise is the setup needs less second guessing, and It works better with a written plan.
การสนทนา
คำถามที่พบบ่อย
ผลิตภัณฑ์ที่มีให้บริการผ่าน cTrader Store รวมถึงบอทการเทรด อินดิเคเตอร์ และปลั๊กอิน มีให้บริการโดยนักพัฒนาบุคคลที่สามและมีไว้เพื่อวัตถุประสงค์ในการเข้าถึงข้อมูลและทางเทคนิคเท่านั้น cTrader Store ไม่ใช่โบรกเกอร์และไม่ได้ให้คำแนะนำการลงทุน คำแนะนำส่วนบุคคล หรือการรับประกันผลการดำเนินงานในอนาคต


ราคา
ตั้งแต่ 19/04/2025
2
การขาย