
MultiTimeFrameTrend
อินดิเคเตอร์
2 การซื้อ
เวอร์ชัน 1.0, Jul 2025
Windows, Mac
4.0
รีวิว: 3
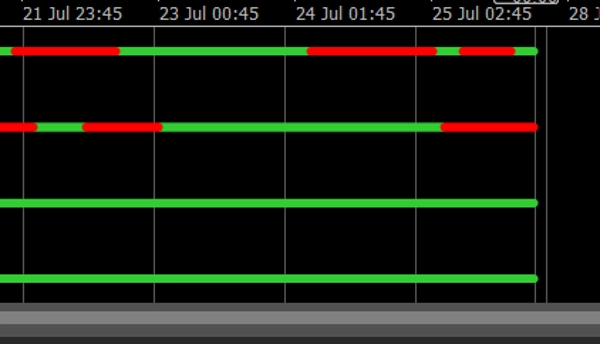
Multi Timeframe Trend Dots เป็นตัวบ่งชี้แนวโน้มที่ทรงพลังและเรียบง่ายที่สร้างขึ้นสำหรับ cTrader ช่วยให้นักเทรดสามารถ ติดตามทิศทางแนวโน้มได้อย่างชัดเจน ใน สูงสุด 4 กรอบเวลาที่เลือกได้ โดยใช้เส้นจุดที่มีรหัสสีง่ายแต่มีประสิทธิภาพ
✅ สีเขียว = แนวโน้มขาขึ้น
✅ สีแดง = แนวโน้มขาลง
✅ เลย์เอาต์ที่สะอาด ในหน้าต่างย่อยเดียว
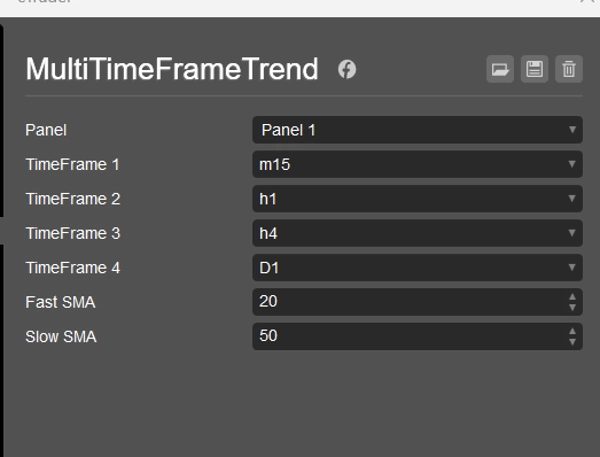
✅ ตั้งค่าได้ตามต้องการ การตั้งค่า SMA เร็ว/ช้า
✅ ใช้งานได้กับ สัญลักษณ์และกรอบเวลาใดก็ได้
ไม่ว่าคุณจะเป็น นักเก็งกำไรระยะสั้น, นักเทรดรายวัน, หรือเทรดเดอร์สวิง ตัวบ่งชี้นี้ช่วยให้คุณเห็นภาพรวมการจัดแนวหลายกรอบเวลาได้อย่างรวดเร็ว — เหมาะสำหรับการเข้าทำรายการอย่างมั่นใจหรือกรองการตั้งค่าที่ไม่ดีออก
💼 ประกอบด้วย:
- ตรรกะแนวโน้มที่อิงจากการตัดกันของ SMA
- การวางจุด 4 ระดับ (ปรับเพื่อให้อ่านง่าย)
- ป้ายกรอบเวลาอยู่ที่ปลายแต่ละเส้นแนวโน้ม
- เข้ากันได้เต็มที่กับทุกเวอร์ชันของ cTrader
🎁 เพื่อนร่วมทางที่สมบูรณ์แบบสำหรับการสร้างกลยุทธ์หรือการเทรดด้วยตนเอง
โปรไฟล์อินดิเคเตอร์
4.0
รีวิว: 3
5 | 0 % | |
4 | 100 % | |
3 | 0 % | |
2 | 0 % | |
1 | 0 % |
รีวิวจากลูกค้า
August 10, 2025
July 30, 2025
The main upside is it brings another read without hijacking the plan, and one green trade proves nothing.
July 29, 2025
The reason it feels usable is the process slows down in a good way, and a 1R exit plan makes review easier.
ผลิตภัณฑ์ที่มีให้บริการผ่าน cTrader Store รวมถึงบอทการเทรด อินดิเคเตอร์ และปลั๊กอิน มีให้บริการโดยนักพัฒนาบุคคลที่สามและมีไว้เพื่อวัตถุประสงค์ในการเข้าถึงข้อมูลและทางเทคนิคเท่านั้น cTrader Store ไม่ใช่โบรกเกอร์และไม่ได้ให้คำแนะนำการลงทุน คำแนะนำส่วนบุคคล หรือการรับประกันผลการดำเนินงานในอนาคต
เพิ่มเติมจากผู้เขียนคนนี้


ตั้งแต่ 21/01/2025
3
การขาย