

Descrizione
Distribuzione Profonda dell'Umore (DMD) 📊🧠
Panoramica
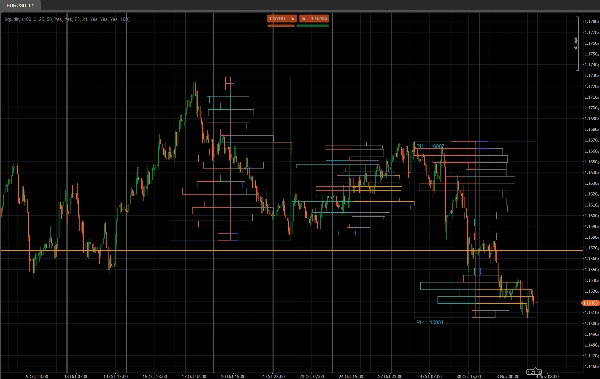
Distribuzione Profonda dell'Umore (DMD) è uno strumento segmentato di profilo volume e sentiment che analizza l'azione del prezzo in blocchi fissi di barre e mostra:
- Dove l'attività di trading è concentrata ⚖️
- Dove la liquidità è scarsa o reattiva (potenziali zone S&D / di liquidità) 💧
- Quale lato domina in ogni area di prezzo (acquirenti vs venditori) 🐂🐻
Invece di un singolo profilo scorrevole, DMD divide il grafico in blocchi ripetuti di X barre e costruisce una mappa separata di liquidità e sentiment per ogni blocco.
Questo rende facile confrontare visivamente come la distribuzione del volume e l'umore del mercato cambiano da un segmento all'altro.
Come funziona 🧩
Per ogni blocco di Bars In Profile candele:
- L'indicatore trova il prezzo più alto e più basso di quel blocco.
- L'intervallo di prezzo è diviso in
Number of Rowsbin di prezzo verticali. - Per ogni candela nel blocco:
-
- Il volume tick è distribuito su ogni bin di prezzo toccato dall'intervallo della candela.
- Due volumi sono accumulati per ogni riga:
-
- Volume totale in quella riga di prezzo
- Volume rialzista (solo barre dove Close > Open)
- Da questi, DMD costruisce:
-
- Profilo di liquidità (lato destro)
-
- La lunghezza della riga ∝ volume relativo rispetto al volume massimo della riga nel blocco
- Il colore mostra nodi scambiati alti / medi / bassi
- Profilo di sentiment (lato sinistro)
-
- Sentiment per riga =
2 × BullishVolume − TotalVolume - Positivo = dominanza degli acquirenti (umore rialzista)
- Negativo = dominanza dei venditori (umore ribassista)
- Sentiment per riga =
- Il processo è ripetuto per gli ultimi N blocchi, così puoi confrontare diversi segmenti affiancati.
Lato destro – Profilo di liquidità (Volume) 📊
Le barre sul lato destro mostrano quanta attività di trading (volume) è avvenuta a ogni livello di prezzo all'interno di quel blocco, indipendentemente da chi stava comprando o vendendo.
- Nodi ad alto volume (HVN) – ad esempio barre arancioni
-
- Una riga il cui volume è ≥
High Traded Threshold %del volume massimo della riga nel blocco - Rappresentano aree di valore, trading intenso, zone di consolidamento.
- Una riga il cui volume è ≥
- Nodi a basso volume (LVN) – ad esempio barre blu
-
- Una riga il cui volume è ≤
Low Traded Threshold %del volume massimo della riga - Rappresentano zone di liquidità scarsa, possibili aree di rifiuto o di movimento rapido.
- Una riga il cui volume è ≤
- Nodi a volume medio – ad esempio barre grigie
-
- Tutto ciò che è tra le soglie alta e bassa
- Livelli di trading “normali”, non estremi.
🧠 Lunghezza della barra (lato destro)
→ Proporzionale al volume totale scambiato in quella riga di prezzo rispetto al volume massimo del blocco.
Più volume → barra più lunga.
Parametri chiave:
High Traded Threshold %Low Traded Threshold %
Lato sinistro – Profilo di Sentiment (Umore del Mercato) 🧠📉📈
Le barre sul lato sinistro mostrano il sentiment / dominanza a ogni livello di prezzo: se gli acquirenti o i venditori erano più forti in quella riga.
Per ogni riga:
Sentiment=2×BullishVolume−TotalVolume\text{Sentiment} = 2 \times \text{BullishVolume} - \text{TotalVolume}Sentiment=2×BullishVolume−TotalVolume
- Barra rialzista (acquirenti al controllo) – ad esempio barre turchesi/verdi
-
- Sentiment > 0
- Più volume proviene da candele rialziste (Close > Open) a quel prezzo.
- Indica dominanza del lato acquisto in quella riga di prezzo.
- Barra ribassista (venditori al controllo) – ad esempio barre rosse
-
- Sentiment < 0
- Più volume proviene da candele ribassiste (Close < Open).
- Indica dominanza del lato vendita.
🧠 Lunghezza della barra (lato sinistro)
→ Proporzionale al valore assoluto del sentiment (|Sentiment|) rispetto alla riga più forte nel blocco.
Dominanza più forte (grande squilibrio tra acquirenti e venditori) → barra più lunga.
Parametro chiave:
Show Sentiment Profile(on/off)
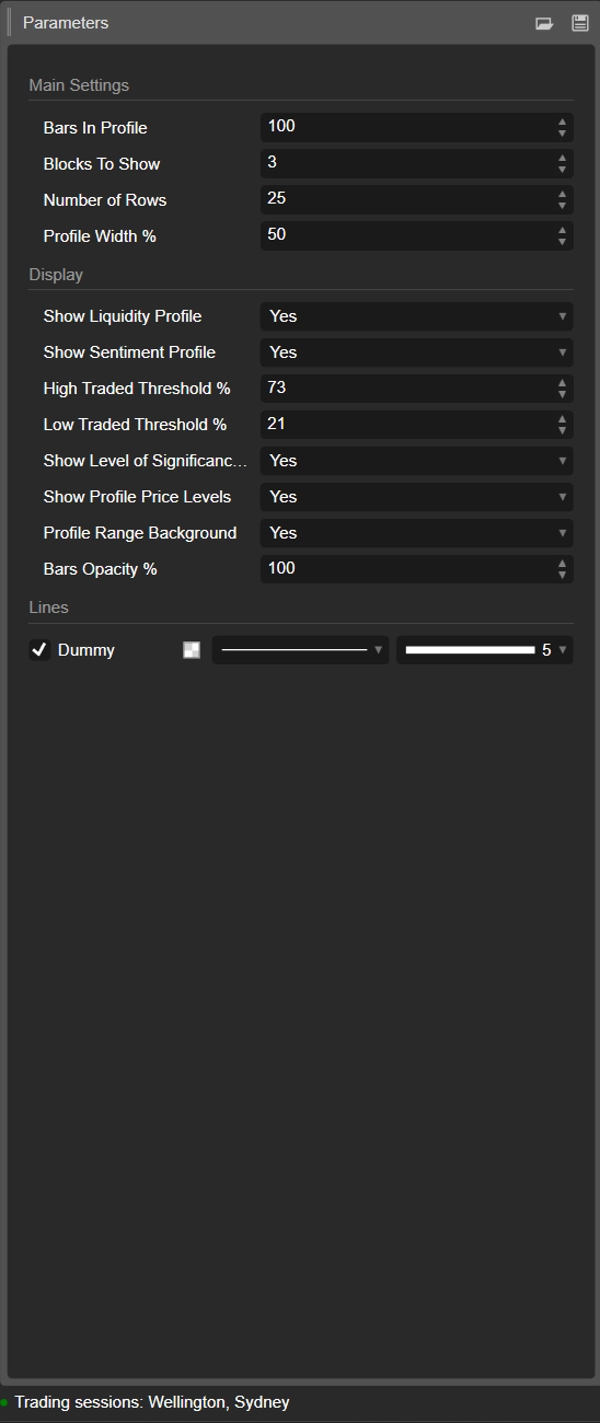
Dettagli dei parametri ⚙️
1. Bars In Profile
Gruppo: Impostazioni Principali
Numero di candele contenute in ogni blocco.
- Esempio:
Bars In Profile = 100 -
- Blocco 0 → ultime 100 barre
- Blocco 1 → 100 barre precedenti
- Blocco 2 → 100 precedenti, e così via.
Usalo per abbinare i blocchi a:
- sessioni approssimative,
- il tuo tipico range swing / intraday,
- o qualsiasi finestra personalizzata che vuoi analizzare.
Valore più piccolo = più reattivo, più granulare.
Valore più grande = struttura più fluida, più “macro”.
2. Blocchi da mostrare
Gruppo: Impostazioni Principali
Quanti blocchi consecutivi saranno disegnati sul grafico.
1→ solo il blocco più recente2–3→ molto pratico per il confronto senza ingombro- Valori più alti → più storia, ma più oggetti sul grafico
I blocchi più vecchi oltre questo valore vengono automaticamente puliti per mantenere la stabilità.
3. Numero di righe
Gruppo: Impostazioni Principali
Risoluzione verticale del profilo di ogni blocco.
L'intervallo di prezzo del blocco è diviso in questo numero di righe (livelli di prezzo).
- Valore più alto → più dettagli, righe più sottili, più rettangoli
- Valore più basso → struttura più fluida, più facile da leggere
Intervalli tipici:
15–25per uso intraday normale30–40+solo se vuoi una risoluzione molto fine e la tua piattaforma è abbastanza potente
4. Larghezza del profilo %
Gruppo: Impostazioni Principali
Controlla quanto il profilo si estende orizzontalmente dal centro del blocco, come percentuale della larghezza del blocco.
- Influisce sia sulla liquidità (lato destro) sia sul sentiment (lato sinistro).
- Percentuale più alta → i profili si estendono più lontano nelle barre circostanti
- Percentuale più bassa → profilo compatto vicino al centro del blocco
Buoni valori iniziali: 35–50%.
5. Mostra Profilo di Liquidità
Gruppo: Visualizzazione
Attiva o disattiva la distribuzione del volume (profilo di liquidità) (lato destro di ogni blocco).
- Attivo ✅
-
- La lunghezza di ogni riga riflette il volume scambiato relativo a quel livello di prezzo.
- Il colore codifica nodi scambiati alti / medi / bassi.
- Disattivo ❌
-
- Viene mostrato solo il sentiment (se abilitato), nessuna barra di volume a destra.
6. Mostra Profilo di Sentiment
Gruppo: Visualizzazione
Attiva o disattiva il profilo di sentiment (lato sinistro di ogni blocco).
- Attivo ✅
-
- Le righe sono colorate:
-
- Rialzista (acquirenti dominanti) – ad esempio acqua/verde
- Ribassista (venditori dominanti) – ad esempio rosso
- La lunghezza della riga riflette la forza della dominanza.
- Disattivo ❌
-
- Viene mostrata solo la pura distribuzione di liquidità/volume.
Usalo se vuoi vedere non solo dove è stato scambiato il volume, ma chi è stato più attivo a quei livelli.
7. High Traded Threshold %
Gruppo: Visualizzazione
Definisce la soglia per nodi ad alto volume (HVN) all'interno di ogni blocco.
- Espresso come % del volume massimo della riga nel blocco.
- Esempio: volume massimo riga = 10.000; soglia = 70% → righe ≥ 7.000 sono considerate HVN.
Gli HVN spesso indicano:
- aree di valore,
- zone di consolidamento,
- aree di forte posizionamento / valore equo.
8. Low Traded Threshold %
Gruppo: Visualizzazione
Definisce la soglia per nodi a basso volume (LVN) rispetto al volume massimo del blocco.
- Le righe con volume sotto questa percentuale sono trattate come zone di bassa attività.
- Queste possono agire come:
-
- tasche di liquidità scarsa,
- livelli potenziali di rifiuto,
- o aree dove il prezzo tende a muoversi rapidamente.
Uso tipico: 15–30%.
9. Mostra Livello di Significatività (POC)
Gruppo: Visualizzazione
Mostra o nasconde il Punto di Controllo (POC) per il blocco più recente.
- POC = riga di prezzo con volume scambiato più alto in quel blocco.
- Visualizzato come una linea orizzontale a quel prezzo. 🎯
Utile come:
- riferimento per la mean-reversion,
- ancora di “prezzo equo” intraday,
- o livello chiave per la gestione del trade.
10. Mostra Livelli di Prezzo del Profilo
Gruppo: Visualizzazione
Mostra etichette di testo per:
- Massimo del Profilo (PH) – prezzo più alto raggiunto nel blocco
- Minimo del Profilo (PL) – prezzo più basso raggiunto nel blocco
Le etichette sono mostrate per il blocco più recente e includono i valori di prezzo esatti.
Ottimo per:
- leggere rapidamente il range attuale,
- impostare stop/target intorno a PH/PL,
- contesto per breakout o rotazioni.
11. Sfondo dell'Intervallo del Profilo
Gruppo: Visualizzazione
Disegna un rettangolo di sfondo semi-trasparente che copre:
- l'intervallo temporale (dalla barra iniziale a quella finale)
- l'intervallo di prezzo (dal minimo al massimo)
Questo separa visivamente i blocchi e fa risaltare ogni intervallo.
Disabilitalo se preferisci un aspetto più pulito e minimalista.
12. Opacità delle Barre %
Gruppo: Visualizzazione
Controlla quanto i rettangoli sono solidi o sottili (sia barre di liquidità che di sentiment).
- 20–40% → molto chiaro, stile sfondo
- 50–70% → visibilità bilanciata, candele ancora facili da vedere
- 80–100% → blocchi forti, quasi completamente opachi
Internamente questo valore viene convertito in un canale alfa (0–255) per i colori delle barre.
Template di partenza suggerito ⭐
Per indici / futures intraday (M5–M15):
- Bars In Profile: 80–120
- Blocks To Show: 2–3
- Number of Rows: ~20
- Profile Width %: 35–45
- Show Liquidity Profile: true
- Show Sentiment Profile: true
- Bars Opacity %: 50–65
Riepilogo
Key features include:
- Liquidity Profile (right side): Displays trading volume concentration at each price level within a block, highlighting high-volume nodes (HVNs), low-volume nodes (LVNs), and average-volume nodes. Bar length corresponds to relative traded volume, and colors indicate volume intensity.
- Sentiment Profile (left side): Shows buyer vs. seller dominance per price level, calculated as twice the bullish volume minus total volume. Positive values indicate buy-side control; negative values indicate sell-side control. Bar length reflects the strength of dominance, with color coding for bullish (green/teal) and bearish (red) sentiment.
- Configurable parameters: number of bars per profile block, number of blocks displayed, vertical resolution (rows), profile width, opacity, and thresholds for defining HVNs and LVNs.
- Additional display options: Point of Control (POC) line for highest volume price in the latest block, profile high/low price labels, and background shading for block ranges.
DMD supports analysis across various markets including indices, commodities, forex, and cryptocurrencies, facilitating identification of trading activity concentration, liquidity zones, and market sentiment shifts within customizable timeframes.
Recensioni dei clienti
5 | 0 % | |
4 | 100 % | |
3 | 0 % | |
2 | 0 % | |
1 | 0 % |


