
MACD Crossover PRO
インジケーター
3 購入済
バージョン 1.0、Oct 2025
Windows、Mac
5.0
レビュー: 1
説明
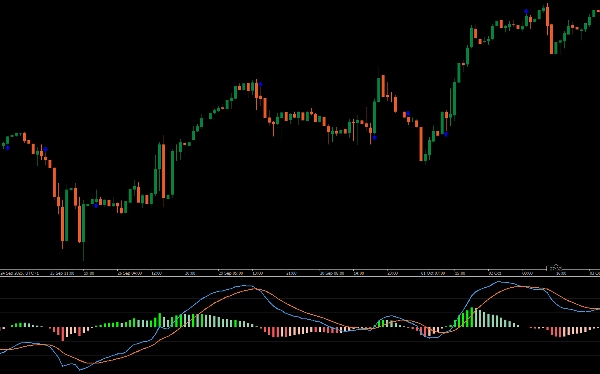
カスタマイズ可能なクラシックなMACDインジケーターをご紹介します。パーソナライズされた機能でトレーディング体験を向上させるよう設計されています。
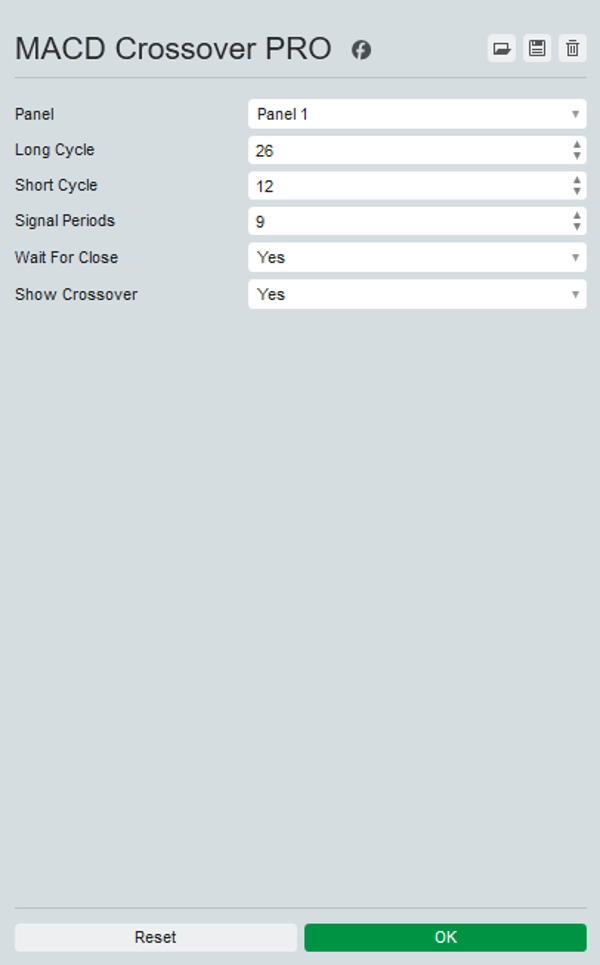
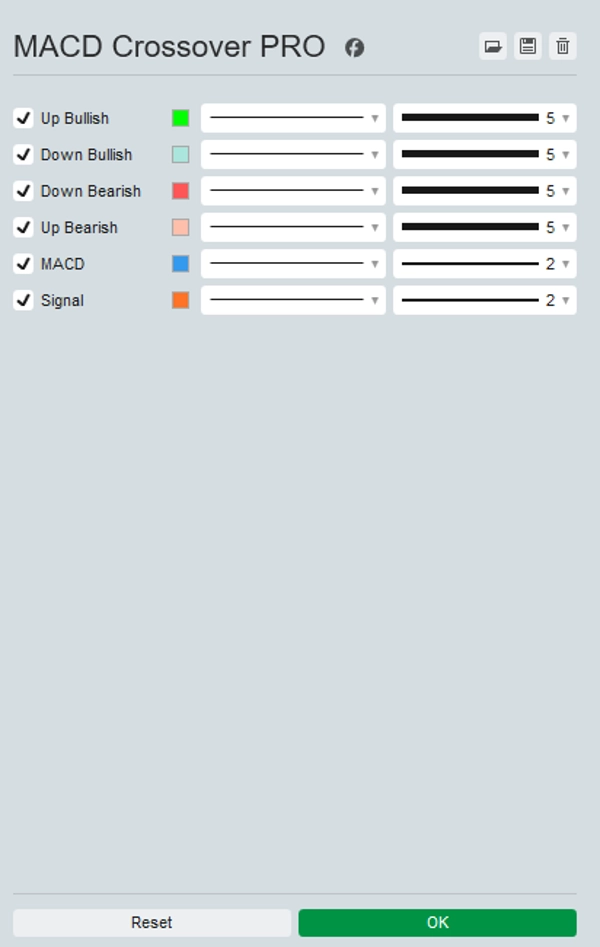
従来のMACDのこのアップグレード版では、ラインやヒストグラムの色をカスタマイズでき、チャートの視認性が向上します。オプションで、ローソク足の終値ではなくティックデータを使用してリアルタイムに更新することも可能で、スピーディーな市場でのタイムリーな洞察を提供します。
さらに、チャート上にクロスオーバーポイントを強調表示し、買いおよび売りのシグナルを見つけやすくします。
カスタマイズ可能なクラシックなMACDインジケーターでトレーディング戦略を強化し、精度と意思決定を向上させましょう。
概要
AIによる概要
MACD Crossover PRO is a customizable version of the classic MACD (Moving Average Convergence Divergence) indicator designed for enhanced trading analysis. It allows users to personalize the colors of the MACD lines and histogram for improved chart clarity. The indicator supports real-time updates based on tick data rather than waiting for candle closes, providing more immediate insights in fast-moving markets. It also visually highlights crossover points on the chart, aiding in the identification of potential buy and sell signals. This tool is applicable across various markets including Forex, cryptocurrencies, stocks, commodities, and indices, supporting symbols such as BTCUSD, EURUSD, GBPUSD, XAUUSD, NAS100, and USDJPY. The indicator is suited for traders employing strategies like scalping and signal-based entries, aiming to improve precision and decision-making through enhanced visualization and timely data updates.
インジケーターのプロフィール
カスタマーレビュー
5.0
レビュー: 1
5 | 100 % | |
4 | 0 % | |
3 | 0 % | |
2 | 0 % | |
1 | 0 % |
カスタマーレビュー
October 15, 2025
The first test should keep DD under 3 percent. The review process gets less scattered.
ディスカッション
よくあるご質問
BTCUSD
Forex
Signal
Indices
EURUSD
Commodities
GBPUSD
NZDUSD
Prop
Scalping
Crypto
Stocks
XAUUSD
NAS100
MACD
USDJPY
cTrader Storeで入手可能な取引ボット、インジケーター、プラグインなどの商品は、第三者の開発者が提供するものであり、情報と技術の取得のみを目的としてご利用いただけます。cTrader Storeはブローカーではなく、投資助言や個人的な推奨を行うことも、将来のパフォーマンスを保証することもありません。


価格
登録日 25/09/2025
25
販売
316
無料インストール