
Beschreibung
ICT Killzones Komplett – Professionelle Analyse der Handelssitzungen
Meistern Sie das Timing institutioneller Handelsaktivitäten mit dem umfassendsten ICT Killzones Indikator für cTrader. Dieses professionelle Tool identifiziert und visualisiert automatisch alle fünf kritischen ICT (Inner Circle Trader) Handelssitzungen und verschafft Ihnen so den Vorteil, gemeinsam mit dem Smart Money zu handeln.
Neu in dieser Version:
- Alle 5 ICT Sitzungen: Vollständige Abdeckung einschließlich Asian Range, London Kill Zone, New York Kill Zone, NY Lunch/Reversal Zone und NY PM Kill Zone
- Intelligentes Farbsystem: Einfache Farbnamen (Rot, Blau, Orange) statt komplexer ARGB-Codes
- Unabhängige Transparenzsteuerung: Opazität für jede Sitzung anpassbar (0-100%)
- Sitzungsspezifische Label-Farben: Label-Farben unabhängig von Zonenfarben anpassbar
- Sitzungsbeschreibungen: Optionale Informationslabels, die die Eigenschaften jeder Sitzung erklären
- Verbesserte Leistung: Optimierter Code mit automatischer Bereinigung alter Zonen
Hauptmerkmale:
📊 Vollständige Sitzungsabdeckung:
- Asian Range (19:00-00:00 NY): Identifiziert Konsolidierungszonen und Liquiditätspools für spätere Angriffe
- London Kill Zone (02:00-05:00 NY): Markiert große Volatilitätsspitzen, ideal für Stop-Hunts und Umkehrungen
- NY Kill Zone (07:00-10:00 NY): Hebt die zweite große Bewegung mit starkem Momentum hervor
- NY Lunch Zone (12:00-13:30 NY): Zeigt Umkehr- und Konsolidierungsphasen
- NY PM Kill Zone (13:30-16:00 NY): Erfasst sekundäre Bewegungen und Markt-Neuausrichtungen
🎨 Einfache Farbanpassung:
- Einfache Farbnamen: einfach "Blau", "Orange", "Lila" usw. eingeben
- Über 50 vordefinierte Farben, darunter DodgerBlue, BlueViolet, MediumAquamarine
- Hex-Farbsupport (#RRGGBB-Format)
- Individuelle Transparenzregler (0-100%) für jede Zone
- Separate Label-Farben für maximale Klarheit
⚙️ Leistungsstarke Anzeigeoptionen:
- Einzelne Sitzungen ein-/ausschalten
- Sitzungsinformationslabels anzeigen/verbergen
- Anpassbare Schriftgröße (6-20)
- Zonen bis zum Diagrammrand erweitern oder begrenzt anzeigen
- Steuerung der Anzahl der anzuzeigenden historischen Tage (1-30 Tage)
- Automatische Bereinigung verhindert Diagrammüberladung
🎯 Professionelles Design:
- Saubere, unaufdringliche Visualisierung
- Dynamische Hoch-/Tief-Verfolgung während aktiver Sitzungen
- Korrekte Behandlung von Übernacht-Sitzungen
- Funktioniert auf allen Zeitrahmen
- Keine Verzögerung, optimierte Leistung
Ideal für:
- ICT-Methodik-Trader, die präzises Timing suchen
- Smart Money Trader, die institutionellen Flüssen folgen
- Daytrader und Scalper, die exakte Sitzungsgrenzen benötigen
- Swing Trader, die wichtige Umkehrzonen identifizieren
- Jeder, der Trades mit wichtigen Marktsitzungen abstimmen möchte
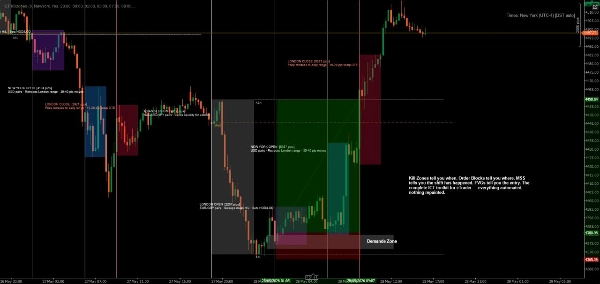
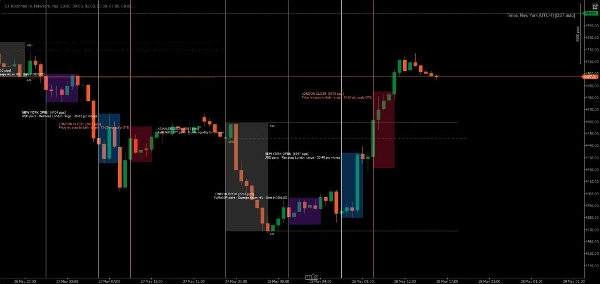
Funktionsweise:
Der Indikator erkennt automatisch jeden Handelstag und erstellt farbcodierte Zonen für alle fünf ICT-Sitzungen. Während der Preis durch jede Sitzung läuft, verfolgt der Indikator das Hoch und Tief und zeichnet die endgültige Zone, wenn die Sitzung schließt. Labels identifizieren jede Sitzung klar und zeigen optional deren Handelsmerkmale an.
Alle Zeiten sind in New York (Eastern) Zeit, gemäß der Standard-ICT-Methodik.
Beispiele für Anpassungen:
- Konservative Einstellung: Niedrige Transparenz (20-30%), dezente Farben, keine Sitzungsinfos
- Kräftige Einstellung: Hohe Transparenz (70-80%), lebendige Farben, vollständige Sitzungsbeschreibungen
- Minimale Einstellung: Unerwünschte Sitzungen ausschalten, nur bevorzugte Killzones behalten
- Farbcodierte Strategie: Zonenfarben an Ihre Handelsrichtung anpassen (grün = long, rot = short)
Systemanforderungen:
- Plattform: cTrader Desktop (cTrader Store Produkte werden in Web- oder Mobilversionen nicht unterstützt) blog.ctrader.com
- Betriebssystem: Windows 7 oder höher
- Prozessor: Dual-Core CPU empfohlen
- Arbeitsspeicher: Mindestens 2 GB RAM (4 GB empfohlen)
- Internetverbindung: 50 kB pro Sekunde oder schneller
Installationsanleitung:
- Kaufen/Installieren: Erwerben Sie den Indikator im cTrader Store
- cTrader Desktop herunterladen: Falls noch nicht installiert, laden Sie ihn von ctrader.com
- Anmelden: Öffnen Sie cTrader Desktop und melden Sie sich mit Ihrer cTrader-ID an
- Indikator aufrufen: Navigieren Sie zum Bereich "Algo" → Liste "Indikatoren"
- Zum Chart hinzufügen: Rechtsklick auf ein beliebiges Chart → "Indikatoren" → Wählen Sie "ICT Killzones Complete"
- Anpassen: Rechtsklick auf den Indikatornamen im Chart → "Einstellungen" zum Anpassen von Farben, Zeiten und Anzeigeoptionen
Tipps für beste Ergebnisse:
- Verwenden Sie Zeitrahmen von 1 Minute bis 1 Stunde für optimale Sichtbarkeit
- Kombinieren Sie mit Preisaktions- und Liquiditätskonzepten für beste Resultate
- Passen Sie die Sitzungszeiten an, wenn Ihr Broker andere Zeitzonen verwendet
- Experimentieren Sie mit der Transparenz, um Ihr perfektes visuelles Gleichgewicht zu finden
- Aktivieren Sie Sitzungsinformationslabels beim Lernen, deaktivieren Sie sie für übersichtlichere Charts
Handeln Sie präzise. Handeln Sie mit Vertrauen. Handeln Sie nach der ICT-Methode.
Hinweis: Dieser Indikator dient zu Bildungs- und Informationszwecken. Vergangene Leistungen garantieren keine zukünftigen Ergebnisse. Üben Sie stets ein angemessenes Risikomanagement.
Zusammenfassung
The indicator tracks high and low prices during active sessions and finalizes zones upon session close, providing clear visual boundaries for institutional trading timing. It supports all timeframes, handles overnight sessions properly, and includes automatic cleanup of old zones to maintain chart clarity. Customization options include font size adjustment, zone extension control, and history length for displayed zones. ICT Killzones Complete is suitable for traders using ICT methodology, smart money concepts, scalping, day trading, and swing trading across markets such as Forex, commodities, and crypto. It requires cTrader Desktop on Windows 7 or higher with recommended hardware specifications.
Kundenbewertungen
5 | 50 % | |
4 | 25 % | |
3 | 0 % | |
2 | 25 % | |
1 | 0 % |


![„[Stellar Strategies] MARSI Signal Plotter“-Logo](https://cdn.ctrader.com/image/webp/7b2b8da6-8f8e-4646-8d4a-4710c516c01e_25567)


