
คำอธิบาย
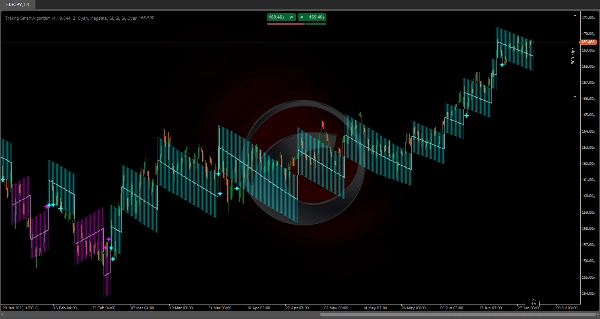
อัลกอริทึมสมาร์ทแบบตามหลัง
https://chartshots.spotware.com/c/69f0f1d89000b
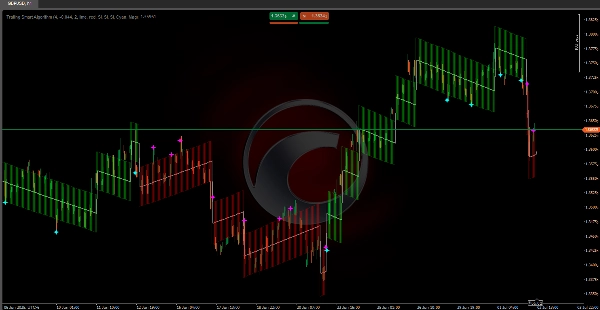
รวมถึง อัลกอริทึมทางคณิตศาสตร์ 🧠 ที่ออกแบบมาโดยเฉพาะเพื่อการติดตามราคาที่สม่ำเสมอใน ทุกสภาวะตลาด 🌐.
โครงสร้างการคำนวณของมันรับประกันว่า เส้นแนวโน้มจะยังคงซิงโครไนซ์ กับการเคลื่อนไหวของราคา หลีกเลี่ยงความล่าช้าทั่วไปของตัวชี้วัดแบบดั้งเดิม ⏳.
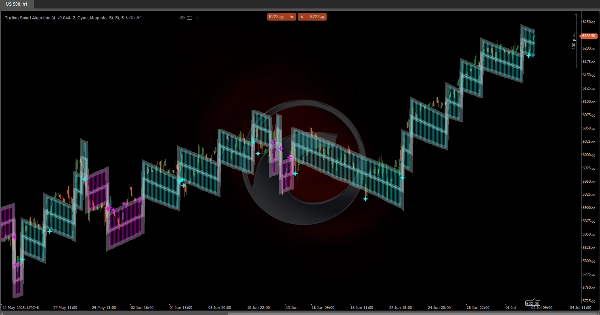
แตกต่างจากอัลกอริทึมทั่วไป ระบบนี้ใช้ การวัดความผันผวนที่แม่นยำ 📊 และใช้ การปรับอัตโนมัติ ⚙️ ที่รับประกันการติดตามที่เหมาะสม การคำนวณภายในถูกสร้างขึ้นเพื่อให้ได้ การแสดงผลที่แม่นยำ ของทิศทางตลาด รักษาความแม่นยำทั้งในช่วงการเคลื่อนไหวอย่างรวดเร็ว ⚡ และการพัฒนาแนวโน้มอย่างค่อยเป็นค่อยไป 🕊️.
https://chartshots.spotware.com/c/69f0f218591b0
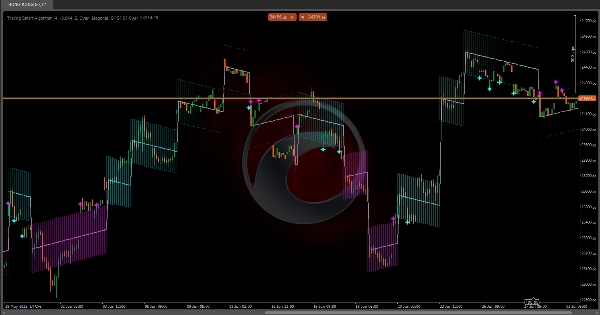
💡 มันทำงานอย่างไร?
ตัวชี้วัดทำงานโดยใช้ ระบบก้าวที่ปรับตัวได้ ที่เคลื่อนที่ไปในทิศทางของแนวโน้มหลัก.
มันอิงตาม สามองค์ประกอบหลัก:
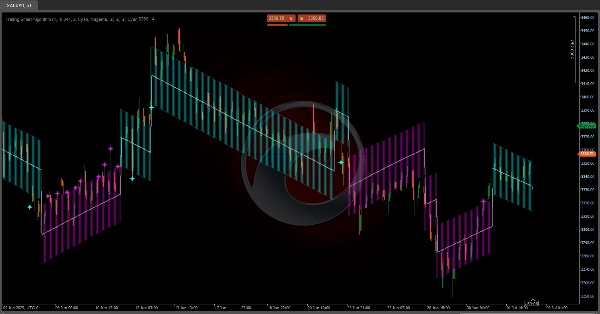
https://chartshots.spotware.com/c/69f0f2b19e4d3
1️⃣ การตรวจจับการเปลี่ยนแปลงแนวโน้ม
ระบบตรวจสอบราคาตลอดเวลาเพื่อจับการเคลื่อนไหวที่สำคัญที่เกินเกณฑ์ที่กำหนด (ทริกเกอร์แรงกระตุ้น 🎯).
เมื่อราคาขยับออกจากเส้นแนวโน้มปัจจุบันมากพอ ตัวชี้วัดจะรับรู้ถึง การเปลี่ยนทิศทางที่เป็นไปได้ และปรับตำแหน่งเส้นหลักใหม่.
2️⃣ การตามหลังแบบไดนามิก
เมื่อกำหนดทิศทางแล้ว เส้นแนวโน้มจะเคลื่อนที่ ทีละก้าว 🪜 ในทิศทางเดียวกับตลาด.
แต่ละก้าวคำนวณจากความผันผวนปัจจุบัน (ATR 📈):
• ใน ตลาดที่มีความผันผวนสูงกว่า ก้าวจะใหญ่ขึ้น 🌊
• ใน ตลาดที่เงียบกว่า ก้าวจะเล็กลง 🌿
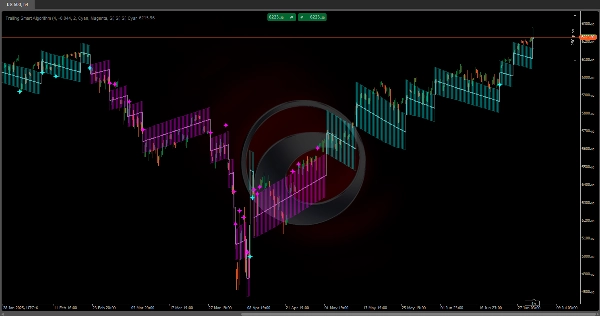
3️⃣ ช่องความผันผวน
ช่องจะก่อตัวรอบเส้นหลัก (แถบบนและล่าง) แสดงถึง โซนความผันผวนปกติ 📉📈.
ช่องนี้ช่วยระบุว่าราคากำลังเคลื่อนไหวภายในพารามิเตอร์ปกติหรือกำลังทำ การเคลื่อนไหวสุดขีด 🚨.
📏 ช่องความผันผวน
• แถบบน: ขีดจำกัดบนของช่องความผันผวน
• แถบล่าง: ขีดจำกัดล่างของช่องความผันผวน
✨ สัญญาณทดสอบซ้ำ
• ดาวสีฟ้าอมเขียว 🌟: ราคาสัมผัสหรือข้ามแถบล่างในระหว่าง แนวโน้มขาขึ้น
• ดาวสีม่วงแดง ⭐: ราคาสัมผัสหรือข้ามแถบบนในระหว่าง แนวโน้มขาลง
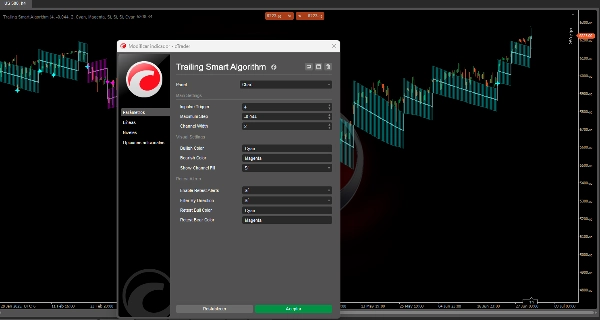
⚙️ การตั้งค่าพารามิเตอร์
🔹 พารามิเตอร์หลัก
ทริกเกอร์แรงกระตุ้น (ค่าเริ่มต้น: 4)
มันทำหน้าที่อะไร?
กำหนด ความไวในการตรวจจับการเปลี่ยนแปลงแนวโน้ม เป็นตัวคูณ ATR ที่กำหนดว่าราคาต้องเคลื่อนไหวมากแค่ไหนเพื่อกระตุ้นการเปลี่ยนทิศทาง.
ผลกระทบเมื่อมีการปรับเปลี่ยน:
• ค่าสูงขึ้น (5–8):
- ทนทานต่อการเปลี่ยนแปลงแนวโน้มมากขึ้น 🛡️
- สัญญาณผิดพลาดน้อยลง
- ตอบสนองช้ากับการเปลี่ยนแปลงจริง
• ค่าต่ำลง (2–3):
- ความไวสูงขึ้น 🎯
- ตอบสนองเร็วขึ้น
- มีแนวโน้มที่จะเกิด สัญญาณผิดพลาด ในตลาดที่เคลื่อนไหวไซด์เวย์
ก้าวสูงสุด (ค่าเริ่มต้น: -0.044)
มันทำหน้าที่อะไร?
จำกัด ขนาดสูงสุดของแต่ละก้าว ที่เส้นแนวโน้มสามารถเคลื่อนที่ได้ เป็นค่าลบที่ทำหน้าที่เป็นขีดจำกัด.
ผลกระทบเมื่อมีการปรับเปลี่ยน:
• ค่าน้อยกว่าลบน้อย (-0.020 ถึง -0.030):
- ก้าวใหญ่ขึ้น 🚀
- การติดตามแนวโน้มที่รุนแรงขึ้น
• ค่ามากกว่าลบ (-0.050 ถึง -0.080):
- ก้าวเล็กลงและ ค่อยเป็นค่อยไปมากขึ้น 🌱
- การติดตามที่ระมัดระวังมากขึ้น
ความกว้างของช่อง (ค่าเริ่มต้น: 2)
มันทำหน้าที่อะไร?
กำหนด ความกว้างของช่องความผันผวน รอบเส้นหลัก.
ผลกระทบเมื่อมีการปรับเปลี่ยน:
• ค่าสูงขึ้น (3–4):
- ช่องกว้างขึ้น 🟢
- สัญญาณทดสอบซ้ำน้อยลง
- ความทนทานต่อความผันผวนสูงขึ้น
• ค่าต่ำลง (1–1.5):
- ช่องแคบลง 🔴
- สัญญาณทดสอบซ้ำมากขึ้น
- ความไวต่อเสียงรบกวนสูงขึ้น
🎨 พารามิเตอร์ภาพ
สีขาขึ้น / สีขาลง
กำหนดสีสำหรับ แนวโน้มขาขึ้นและขาลง ตามลำดับ.
แสดงการเติมช่อง
เปิดหรือปิด การเติมภาพ ของช่องความผันผวน 🌈.
🔔 การตั้งค่าการทดสอบซ้ำ
เปิดใช้งานการแจ้งเตือนทดสอบซ้ำ
สลับสัญญาณทดสอบซ้ำเมื่อราคาสัมผัสแถบช่อง.
กรองตามทิศทาง
เมื่อเปิดใช้งาน จะแสดงเฉพาะ สัญญาณทดสอบซ้ำที่ตรงกับแนวโน้มปัจจุบัน:
• ใน แนวโน้มขาขึ้น: แสดงเฉพาะสัญญาณบน แถบล่าง
• ใน แนวโน้มขาลง: แสดงเฉพาะสัญญาณบน แถบบน
🌟 สรุปสัญญาณทดสอบซ้ำ
• ดาวสีฟ้าอมเขียวบนแถบล่าง: การดีดตัวขาขึ้นที่เป็นไปได้ จากแนวรับไดนามิก ✅
• ดาวสีม่วงแดงบนแถบบน: การดีดตัวขาลงที่เป็นไปได้ จากแนวต้านไดนามิก ❌
สรุป
รีวิวจากลูกค้า
5 | 100 % | |
4 | 0 % | |
3 | 0 % | |
2 | 0 % | |
1 | 0 % |


