
คำอธิบาย
Coppock Curve คืออะไร?
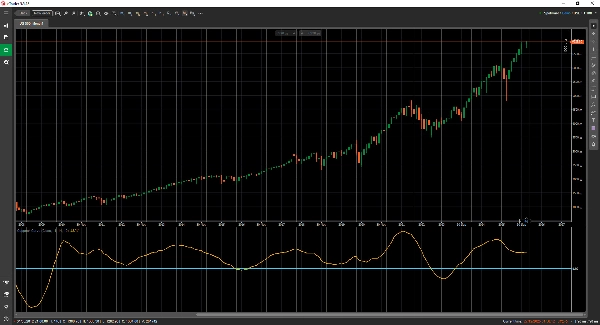
Coppock Curve เป็นตัวบ่งชี้โมเมนตัมระยะยาวที่ออกแบบมาเพื่อระบุจุดต่ำสุดของตลาดหลักทรัพย์ S&P 500 โดยถูกสร้างขึ้นในปี 1962 โดยนักเศรษฐศาสตร์ Edwin Coppock ซึ่งได้รับคำขอจากโบสถ์ Episcopal ให้ค้นหาโอกาสในการซื้อที่มีความเสี่ยงต่ำสำหรับกองทุนมรดกของพวกเขา
พูดง่ายๆ คือ มันเป็นออสซิลเลเตอร์ที่ติดตามแนวโน้มซึ่งบอกคุณว่าเมื่อใดที่ตลาดหมีน่าจะถึงจุดต่ำสุดและตลาดกระทิงใหม่กำลังเริ่มต้น
“สูตรลับ” (วิธีการทำงาน)
แตกต่างจากตัวบ่งชี้หลายตัวที่ตอบสนองเร็วและไม่เสถียร Coppock Curve ถูกออกแบบให้ช้าโดยเจตนา มันถูกคำนวณโดยการนำค่าเฉลี่ยเคลื่อนที่ถ่วงน้ำหนัก (WMA) ของผลรวมของอัตราการเปลี่ยนแปลง (ROC) สองค่าแตกต่างกัน
Coppock = WMA(10) ของ (ROC(14) + ROC(11))
ตรรกะ:
มันวัดอัตราการเปลี่ยนแปลงของโมเมนตัมราคาตลอดช่วงเวลานาน (โดยปกติคือ 11 และ 14 เดือน) โดยการทำให้ข้อมูลนี้เรียบด้วยค่าเฉลี่ยถ่วงน้ำหนัก มันจึงกรองเสียงรบกวนของตลาดระยะสั้นออกเกือบทั้งหมด
ข้อเท็จจริงสนุกๆ:
Coppock เล่าว่าเขาเคยถามบิชอปว่าต้องใช้เวลานานแค่ไหนสำหรับคนที่จะฟื้นตัวจากความเศร้าของการสูญเสียคนที่รัก พวกเขาตอบว่า “11 ถึง 14 เดือน” เขานำกรอบเวลานั้นมาใช้กับตลาด โดยให้เหตุผลว่าจิตวิทยาตลาดมีวงจรของความเศร้าและการฟื้นตัวที่คล้ายกัน
ทำไมมันถึงมีประโยชน์?
นักเทรดและนักลงทุนชื่นชอบ Coppock Curve ด้วยเหตุผลหลักสามประการ:
- มันกรองเสียงรบกวน: เนื่องจากมันถูกคำนวณบนกรอบเวลารายเดือน (ตามแบบดั้งเดิม) มันจึงไม่สนใจความผันผวนรายวันหรือแม้แต่รายสัปดาห์ มันไม่ค่อยส่งสัญญาณบ่อย แต่เมื่อส่งสัญญาณ มักจะมีความสำคัญ
- สัญญาณซื้อที่ชัดเจน: สัญญาณเป็นแบบไบนารีและอ่านง่าย สัญญาณ “ซื้อ” จะเกิดขึ้นเมื่อเส้นโค้งอยู่ต่ำกว่าศูนย์และเริ่มขึ้น (เริ่มเพิ่มขึ้น)
- จุดยึดทางจิตวิทยา: มันป้องกันคุณจากการพยายาม “จับมีดที่กำลังตก” มันบังคับให้คุณรอจนกว่าโมเมนตัมจะเปลี่ยนจากลบเป็นบวกทางคณิตศาสตร์ก่อนที่จะเข้าตำแหน่ง
เมื่อใดควรใช้
- เหมาะสำหรับ: การลงทุนระยะยาว การจัดสรรเงินเกษียณ และการระบุจุดเริ่มต้นของตลาดกระทิงใหม่
- ไม่เหมาะสำหรับ: การเทรดรายวันหรือการชอร์ต มันไม่ได้ถูกออกแบบมาเพื่อระบุสัญญาณขายหรือจุดสูงสุดของตลาด


!["[Hamster-Coder] Bollinger Bands" โลโก้](https://cdn.ctrader.com/image/webp/21d8e5d6-fb11-4bac-b9ee-cd05c2b76804_30327)


