
Moving Average Plus
อินดิเคเตอร์
144 ดาวน์โหลด
เวอร์ชัน 1.0, Aug 2025
Windows, Mac
คำอธิบาย
ทั่วโลก
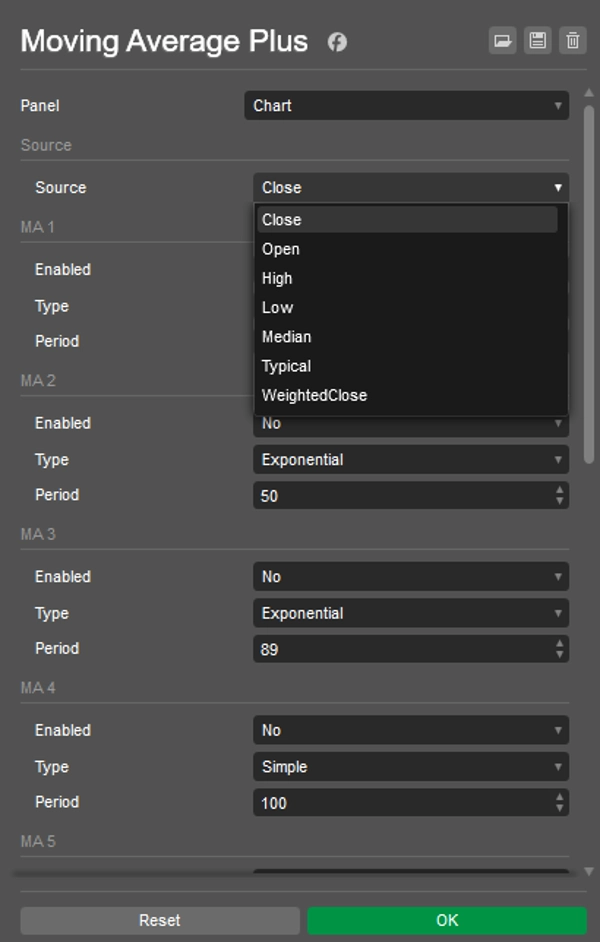
- แหล่งที่มา – ราคาที่ใช้กับทุกเส้น: ปิด, เปิด, สูง, ต่ำ, มัธยฐาน, ทั่วไป หรือ ปิดถ่วงน้ำหนัก.
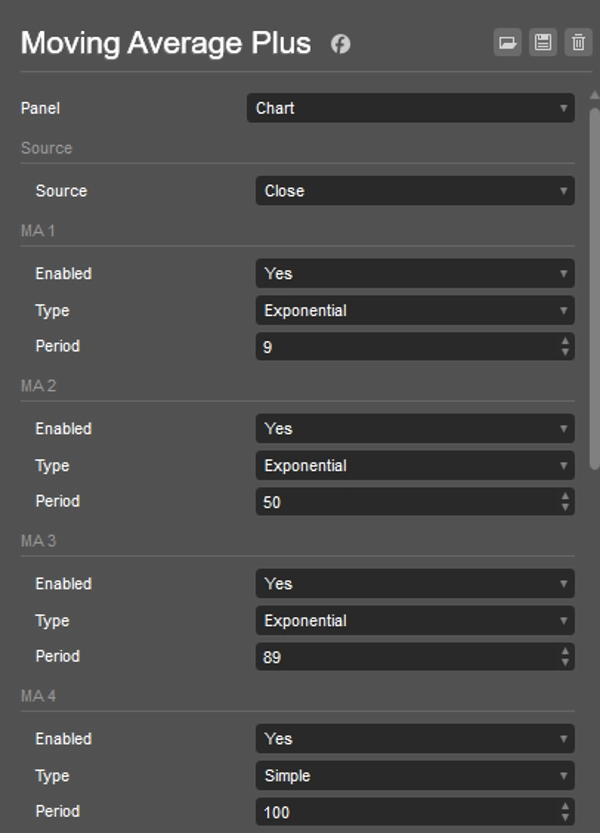
ต่อเส้น (MA 1 … MA 10)
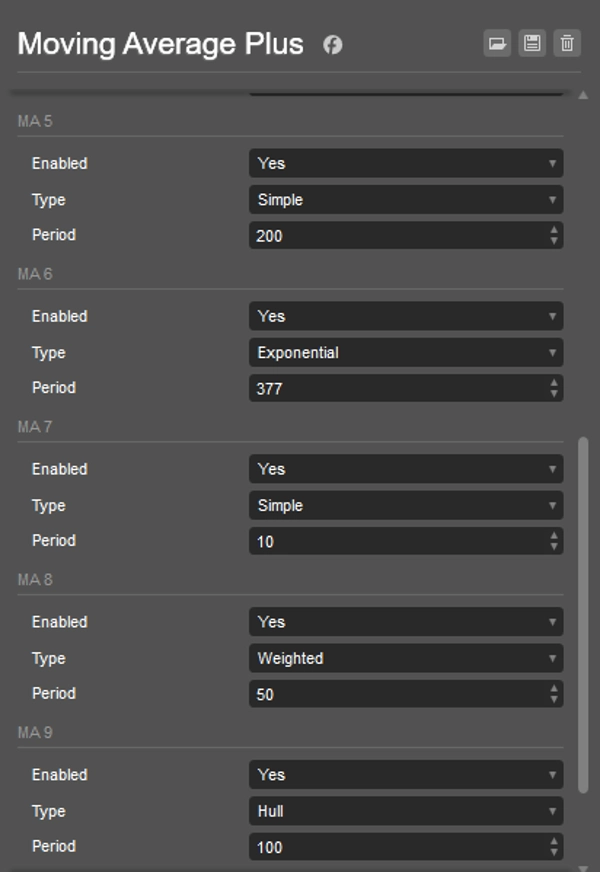
- เปิดใช้งาน – เปิด/ปิดเส้น (เส้นที่ปิดใช้งานจะไม่คำนวณ).
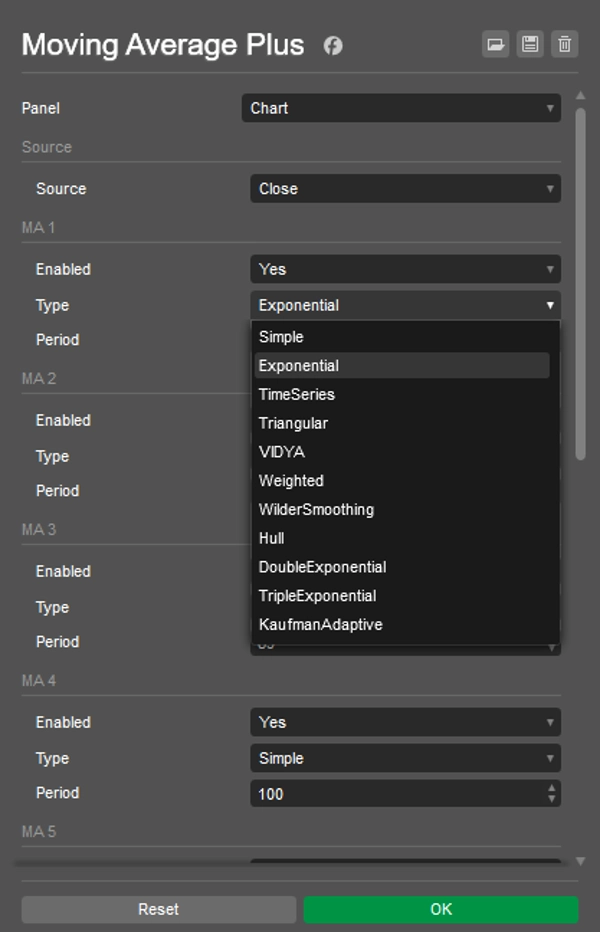
- ประเภท – เลือกจาก
MovingAverageTypeของ cTrader (เช่น Simple, Exponential, Weighted, Wilder Smoothing, Hull, Triangular, Time Series เป็นต้น).
หมายเหตุ: ประเภทบางอย่างขึ้นอยู่กับเวอร์ชันของ cTrader ของคุณ; หากประเภทใดไม่พร้อมใช้งาน (เช่น Hull) ให้เลือกประเภทอื่นแทน. - ช่วงเวลา – ความยาว MA (≥1).
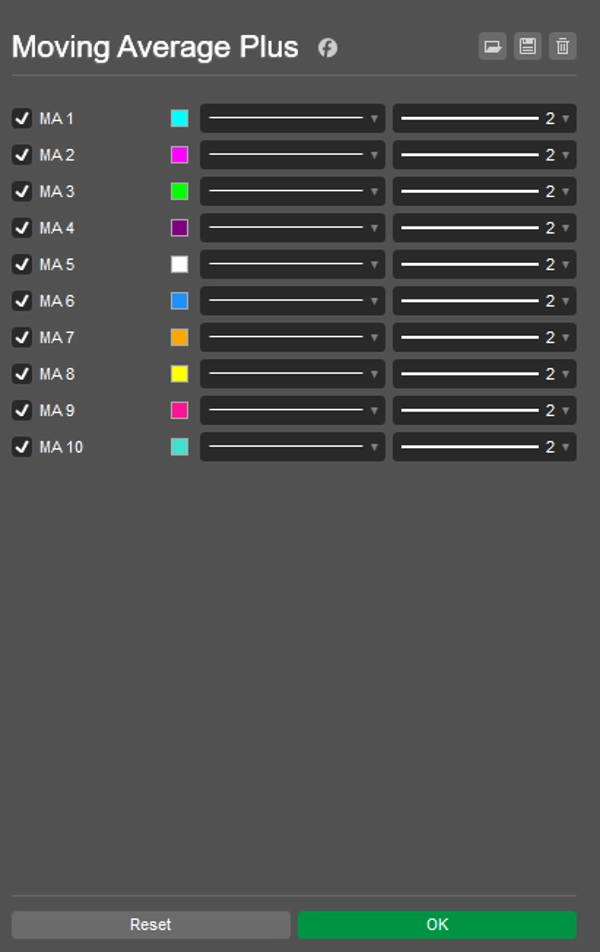
สี & ความหนา
- ตั้งค่าในแท็บ สี ของพารามิเตอร์ตัวบ่งชี้สำหรับแต่ละผลลัพธ์ (“MA 1” … “MA 10”).
เคล็ดลับ
- เพื่อประสิทธิภาพ ให้ปิดเส้นที่ไม่ได้ใช้งาน.
- หากคุณเปลี่ยน แหล่งที่มา หรือ ประเภท/ช่วงเวลา ตัวบ่งชี้จะคำนวณใหม่โดยอัตโนมัติ.
- Wilder ใน cTrader เรียกว่า Wilder Smoothing (
MovingAverageType.WilderSmoothing).
สรุป
สรุปโดย AI
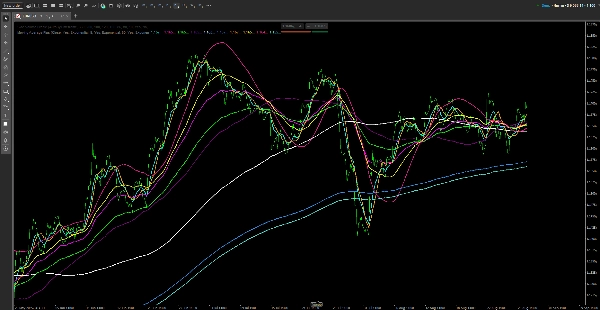
Moving Average Plus is a technical indicator for trading platforms that provides up to 10 configurable moving average lines. Each line can be individually enabled or disabled to optimize performance. Users select a single price source—such as Close, Open, High, Low, Median, Typical, or Weighted Close—that applies to all moving averages. For each line, the type of moving average can be chosen from various options including Simple, Exponential, Weighted, Wilder Smoothing, Hull, Triangular, and Time Series, depending on platform support. The period (length) of each moving average is adjustable with a minimum of 1. Colors and line thickness for each moving average are customizable through the indicator’s color settings. The indicator automatically recalculates when changes are made to the price source, type, or period. This tool is designed to assist traders in analyzing price trends by overlaying multiple moving averages with flexible configurations on their charts.
โปรไฟล์อินดิเคเตอร์
รีวิวจากลูกค้า
0.0
รีวิว: 0
รีวิวจากลูกค้า
ยังไม่มีรีวิวสำหรับผลิตภัณฑ์นี้ หากเคยลองแล้ว ขอเชิญมาเป็นคนแรกที่บอกคนอื่น!
การสนทนา
คำถามที่พบบ่อย
ผลิตภัณฑ์ที่มีให้บริการผ่าน cTrader Store รวมถึงบอทการเทรด อินดิเคเตอร์ และปลั๊กอิน มีให้บริการโดยนักพัฒนาบุคคลที่สามและมีไว้เพื่อวัตถุประสงค์ในการเข้าถึงข้อมูลและทางเทคนิคเท่านั้น cTrader Store ไม่ใช่โบรกเกอร์และไม่ได้ให้คำแนะนำการลงทุน คำแนะนำส่วนบุคคล หรือการรับประกันผลการดำเนินงานในอนาคต


ราคา
ตั้งแต่ 26/05/2025
449.3M
ปริมาณการเทรด
61.1K
Pips ที่ได้กำไร
15
การขาย
1.43K
ติดตั้งฟรี