
คำอธิบาย
🔷 Trend Lines Premium Engine
Multi-Layer Market Structure & Dynamic Regression Indicator
https://chartshots.spotware.com/c/69d3c949a2e08
📌 มันคืออะไร?
Trend Lines Premium Engine คืออินดิเคเตอร์แบบทับซ้อนที่รวม 5 โมดูลอิสระ เข้าเป็นเครื่องมือเดียว แต่ละโมดูลสามารถเปิดหรือปิดได้ มันทำแผนที่โครงสร้างตลาด ช่องไดนามิก และโซนรีเกรสชันที่อิงปริมาณโดยตรงบนกราฟราคา
มันตอบคำถามหลักสามข้อ:
- ราคาปัจจุบันอยู่ที่ไหนในโครงสร้างปัจจุบัน?
- แนวโน้มหลักคืออะไรและจุดที่เกิดการแตกหักอยู่ที่ไหน?
- กิจกรรมมุ่งเน้นที่ระดับราคาใดบ้าง?
🧩 โมดูลทั้ง 5
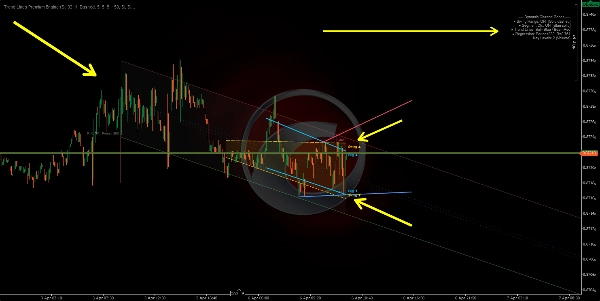
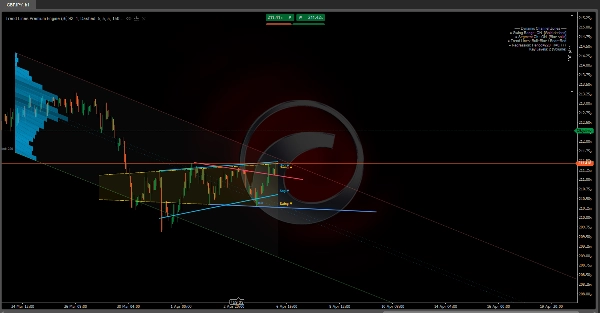
1️⃣ Swing Range Connector
https://chartshots.spotware.com/c/69d3cab9b805b
ตรวจจับ swing highs และ swing lows ล่าสุด จากนั้นวาด ช่องลาดเอียง เชื่อมจุดเก่าที่สุดกับจุดใหม่ที่สุดทั้งสองด้าน พื้นที่ระหว่างถูกเติมเป็นโซนช่วงไดนามิก
วิธีการทำงาน:
- แท่งบาร์จะถูกนับเป็นจุด swing เมื่อ high (หรือ low) ของมันเป็นค่าที่สุดขีดเมื่อเทียบกับ N แท่งก่อนหน้าและหลัง
- เส้นตรงถูกวาดจาก swing เก่าที่สุดไปยัง swing ล่าสุด สร้างขอบบนและล่าง
- ช่องจะเลื่อนโดยอัตโนมัติทุกครั้งที่มีการยืนยันจุด swing ใหม่
วิธีอ่าน:
- ราคาภายในช่อง → ช่วงโครงสร้างที่กำหนด
- ทะลุขึ้นหรือลง → การขยายความผันผวนหรือการเปลี่ยนแปลงโครงสร้าง
- ความลาดเอียงของช่อง → ทิศทางช่วงที่โดดเด่น
พารามิเตอร์
วัตถุประสงค์
Bars Before / After Swing
จำนวนแท่งที่ต้องการในแต่ละด้านเพื่อยืนยัน swing ยิ่งมาก = swing ที่สำคัญมากขึ้น
Max Swing Points
จำนวน swing ที่จะเก็บ ควบคุมความลึกของช่อง
History Window
ระยะเวลาย้อนหลังที่ช่องถูกวาด
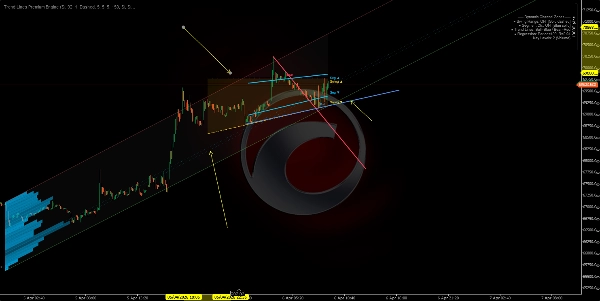
2️⃣ Segment Linear Channel
https://chartshots.spotware.com/c/69d3cb221bba1
แบ่งหน้าต่างวิเคราะห์ออกเป็น 5 ช่วงเท่าๆ กัน, หาค่าสูงสุดและต่ำสุดในแต่ละช่วง จากนั้นใส่เส้น เส้นรีเกรสชันแบบน้อยที่สุด ผ่านจุดบน 5 จุด และอีกเส้นผ่านจุดล่าง 5 จุด
วิธีการทำงาน:
- หน้าต่างถูกแบ่งเป็น 5 ส่วน ดึงค่าที่สุดขีดตัวแทนแต่ละส่วนออกมา
- ใช้การถดถอยเชิงเส้นกับจุดทั้ง 5 สำหรับแต่ละขอบเขต
- ผลลัพธ์คือช่องที่ปรับตัวตาม โครงสร้างราคาที่แบ่งช่วง แทนที่จะใช้แค่สองจุดปลาย
วิธีอ่าน:
- ช่องขึ้น → แนวโน้มขาขึ้นเชิงโครงสร้าง
- ช่องลง → แนวโน้มขาลงเชิงโครงสร้าง
- การสัมผัสซ้ำที่ขอบเขต → การสนับสนุน/ต้านทานแบบไดนามิก
ความแตกต่างจากโมดูล 1: Swing Range เชื่อมแค่ swing แรกและสุดท้าย Segment Channel ใช้รีเกรสชัน 5 จุด ทำให้เรียบกว่าและตอบสนองน้อยกว่าต่อ swing เดียว
3️⃣ Swing Point Labels
ตรวจจับ swing highs และ lows และจัดประเภทเป็น 4 หมวดหมู่โครงสร้างตลาด:
ป้าย
ความหมาย
บ่งชี้
HL
Higher Low
โครงสร้างขาขึ้น
HH
Higher High
โครงสร้างขาขึ้น
LH
Lower High
โครงสร้างขาลง
LL
Lower Low
โครงสร้างขาลง
วิธีการทำงาน:
- แต่ละ swing low ใหม่จะถูกเปรียบเทียบกับ swing low ก่อนหน้า สูงกว่า → HL ต่ำกว่า → LL
- แต่ละ swing high ใหม่จะถูกเปรียบเทียบกับ swing high ก่อนหน้า สูงกว่า → HH ต่ำกว่า → LH
วิธีอ่าน:
- HL + HH ลำดับ → แนวโน้มขาขึ้นยังคงอยู่
- LH + LL ลำดับ → แนวโน้มขาลงยังคงอยู่
- HL ที่แตกเป็น LL หรือ LH ที่แตกเป็น HH → การเปลี่ยนแปลงโครงสร้าง (BOS/CHoCH).
โดยค่าเริ่มต้นจะแสดงแค่ HL และ LH เพื่อให้กราฟดูสะอาดตา HH และ LL สามารถเปิดใช้งานเพื่อดูโครงสร้างทั้งหมดได้
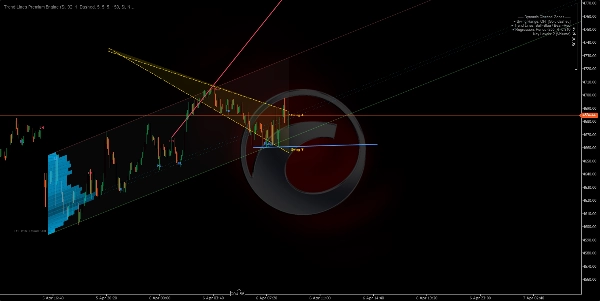
4️⃣ Automatic Trend Lines
https://chartshots.spotware.com/c/69d3cc071272e
วาดเส้นแนวโน้มเชื่อม สอง swing lows ล่าสุด (เส้นขาขึ้น) และ สอง swing highs ล่าสุด (เส้นขาลง) เส้นที่ใช้งานจะโดดเด่น เส้นก่อนหน้าจะจางลง
วิธีการทำงาน:
- ตรวจพบ swing low ใหม่ → วาดเส้นจาก swing low ก่อนหน้าไปยัง swing low ใหม่ (เส้นแนวโน้มขาขึ้น)
- ตรวจพบ swing high ใหม่ → วาดเส้นจาก swing high ก่อนหน้าไปยัง swing high ใหม่ (เส้นแนวโน้มขาลง)
- เส้นจะยืดออกไปข้างหน้าตามจำนวนแท่งที่ตั้งค่าได้
- เมื่อสร้างเส้นใหม่ เส้นก่อนหน้าจะจางเป็นสีโปร่งแสง
สัญญาณเบรกเอาท์ (ตัวเลือก): เมื่อเปิดใช้งาน อินดิเคเตอร์จะตรวจสอบว่าราคาปิดข้ามเส้นแนวโน้มที่ใช้งานอยู่หรือไม่:
- 🔼 ลูกศรขึ้น → เบรกเอาท์ขาขึ้น
- 🔽 ลูกศรลง → เบรกเอาท์ขาลง
พารามิเตอร์
วัตถุประสงค์
Max Line Pairs
จำนวนคู่เส้นที่แสดงให้เห็น ตั้งค่าเป็น 1 เพื่อมุมมองที่สะอาดที่สุด
Max Extension Bars
ระยะที่เส้นยืดออกไปข้างหน้า ป้องกันไม่ให้เส้นข้ามกราฟทั้งหมด
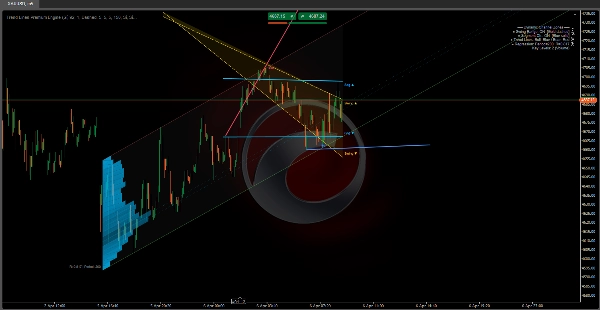
5️⃣ Dynamic Regression Zone
โมดูลที่ซับซ้อนที่สุด คำนวณ ช่องรีเกรสชันเชิงเส้น าบนราคาปิดและซ้อนทับด้วย โปรไฟล์กิจกรรม (ฮิสโตแกรม) แสดงว่าปริมาณหรือการสัมผัสมุ่งเน้นที่ใดภายในช่อง นอกจากนี้ยังทำเครื่องหมาย ระดับสำคัญ ที่โซนกิจกรรมสูงสุด
A) ช่องรีเกรสชัน:
- ใช้การถดถอยเชิงเส้นแบบน้อยที่สุดกับราคาปิดในช่วงเวลาที่กำหนด
- คำนวณส่วนเบี่ยงเบนมาตรฐานของราคาจากเส้นรีเกรสชัน
- วางแถบบนและล่างที่ N ส่วนเบี่ยงเบนมาตรฐานจากศูนย์กลาง (ค่าเริ่มต้น: 2.0)
- เลือกคำนวณใน สเกลลอการิทึม เพื่อความแม่นยำที่ดีกว่าสำหรับเครื่องมือที่มีราคาสูงหรือความผันผวนสูง
B) การตรวจจับช่วงเวลาอัตโนมัติ:
- อัลกอริทึมทดสอบช่วงเวลาหลายช่วง (50 ถึง 400 แท่ง) และคำนวณ สัมประสิทธิ์สหสัมพันธ์เพียร์สัน สำหรับแต่ละช่วง
- เลือกช่วงเวลาที่มีค่าสหสัมพันธ์สูงสุด — ที่เส้นรีเกรสชันเชิงเส้น เหมาะสมที่สุด กับการเคลื่อนไหวของราคา
- ค่าสหสัมพันธ์จะแสดงบนกราฟ (เช่น R = 0.85).
C) ฮิสโตแกรมกิจกรรม:
- ช่องถูกแบ่งเป็นส่วนแนวนอน (สูงสุด 25 ส่วน)
- สำหรับแต่ละส่วน อัลกอริทึมนับจำนวนแท่งที่สัมผัสระดับราคานั้น โดยถ่วงน้ำหนักด้วย ปริมาณ หรือ จำนวนการสัมผัส (ตั้งค่าได้)
- ส่วนที่มีกิจกรรมสูงกว่าจะปรากฏเป็นแท่งที่ยาวกว่าและทึบกว่า
- นี่แสดงถึง จุดควบคุม (POC) และโซนกิจกรรมสูง/ต่ำภายในช่อง
D) ระดับสำคัญ:
- ส่วนที่มีกิจกรรมสูงสุดจะถูกฉายไปข้างหน้าเป็น เส้นแนวนอน.
- เส้นเหล่านี้ทำหน้าที่เป็น แนวรับและแนวต้านที่อิงปริมาณ ภายในบริบทของรีเกรสชัน
วิธีอ่าน:
- ราคาที่ใกล้ แถบบน → โซนที่ซื้อมากเกินไปทางสถิติ
- ราคาที่ใกล้ แถบล่าง → โซนที่ขายมากเกินไปทางสถิติ
- R ใกล้ 1 หรือ -1 → แนวโน้มเชิงเส้นที่แข็งแกร่งและน่าเชื่อถือ R ใกล้ 0 → ช่วงหรือรีเกรสชันไม่สำคัญ
- ระดับสำคัญ ทำหน้าที่เหมือนแม่เหล็กราคา — โซนที่มีการรวมตัวของกิจกรรมในอดีตมักดึงราคากลับมา
🎯 กรณีการใช้งาน
กรณีการใช้งาน
โมดูล
ระบุโครงสร้างตลาด (ขาขึ้น/ขาลง/ช่วง)
Swing Labels + Trend Lines
ตรวจจับแนวรับและแนวต้านแบบไดนามิก
Swing Range + Segment Channel
ค้นหาโซนมูลค่าตามปริมาณ
Regression Zone + Key Levels
ยืนยันการแตกโครงสร้าง
Trend Lines + Breakout Signals
วัดความแข็งแกร่งของแนวโน้ม
สัมประสิทธิ์สหสัมพันธ์เพียร์สัน (Regression Zone)
⚙️ การตั้งค่าที่แนะนำตามสไตล์
สไตล์
โมดูลที่แนะนำ
Scalping (M1–M15)
Swing Labels + Trend Lines
Intraday (M15–H1)
ทุกโมดูล
Swing Trading (H4–D1)
Swing Range + Regression Zone + Key Levels
การวิเคราะห์โครงสร้างบริสุทธิ์
Swing Labels + Trend Lines เท่านั้น
⚠️ หมายเหตุสำคัญ
สรุป
The five modules include:
1. Swing Range Connector: Detects recent swing highs and lows to draw a sloped channel representing the structural range.
2. Segment Linear Channel: Divides the analysis window into five segments, fitting regression lines through highs and lows for a smoother channel.
3. Swing Point Labels: Classifies swing highs and lows into four market structure categories (Higher High, Higher Low, Lower High, Lower Low) to indicate bullish or bearish trends and structure shifts.
4. Automatic Trend Lines: Connects the two most recent swing highs and lows with trend lines, highlighting active lines and optionally signaling breakouts.
5. Dynamic Regression Zone: Calculates a linear regression channel on closing prices with an activity histogram showing volume or touch concentration, marking key volume-based support and resistance levels.
The indicator supports various trading styles, recommending specific module combinations for scalping, intraday, swing trading, and pure structure analysis. It requires price bars and volume data and provides visualizations and signals including breakout, trend strength, and level touches or breaks.


