
Opis
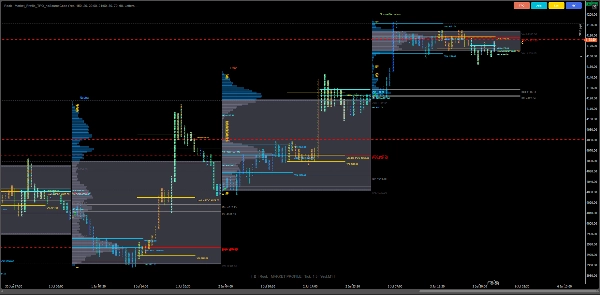
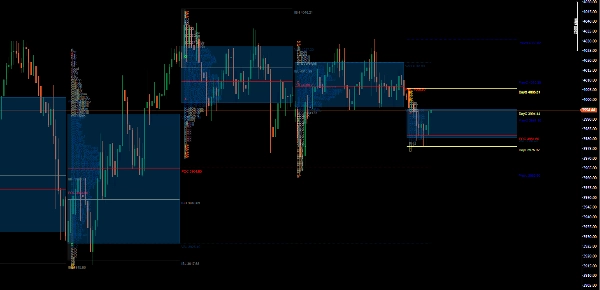
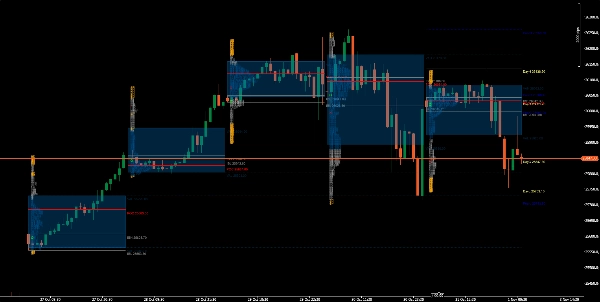
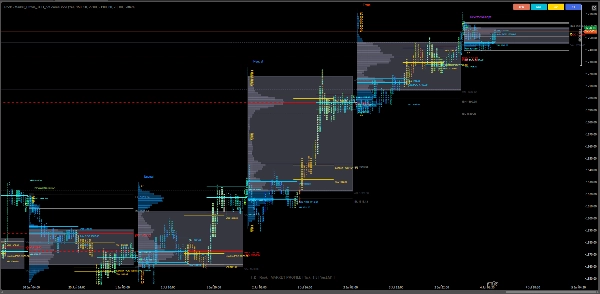
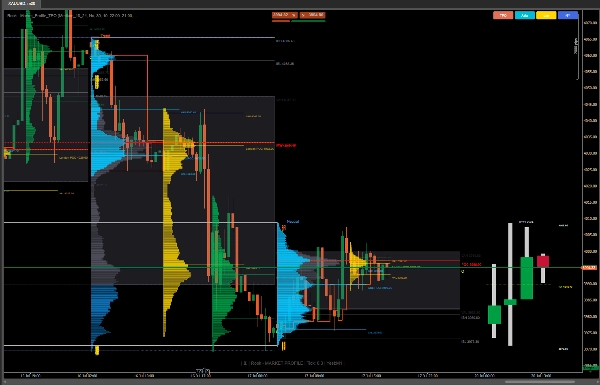
Market Profile TPO (Time Price Opportunity) wprowadza wizualizację struktury rynku na poziomie instytucjonalnym do cTrader — umożliwiając traderom obserwację, jak cena, czas i wolumen współdziałają w różnych sesjach w jednym inteligentnym widoku.
Stworzony dla profesjonalnych traderów dziennych, analityków rynku aukcyjnego oraz entuzjastów przepływu zleceń, ten wskaźnik dostarcza prawdziwą reprezentację aktywności rynkowej za pomocą liter TPO, pudełek i histogramów. Pomaga zidentyfikować obszary wartości, strefy POC, zakresy początkowego balansu oraz poziomy naked z precyzyjną dokładnością.
⚙️ Główne funkcje
✅ Wizualizacja (TPO)
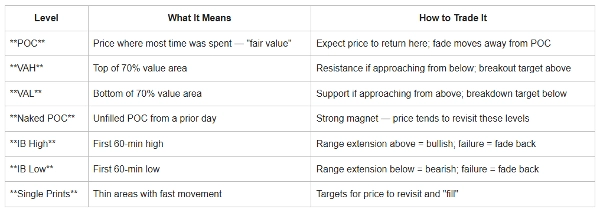
✅ Strefy POC i obszaru wartości
✅ Rozwijający się POC
✅ Wykrywanie początkowego balansu (IB)
✅ Inteligencja sesji i stref czasowych
✅ Tryby wyświetlania TPO (Litery / Histogram)
✅ Markery cen otwarcia/zamknięcia (O/X)
✅ Pojedyncze wydruki i poziomy naked POC/VA
✅ Nakładka OHLC dnia i poprzedniego dnia
✅ Nakładka OHLC dnia i poprzedniego dnia
✅ Projekcja słupków HTF (AMD)
Główne ulepszenia
✔ Szybsze ładowanie
✔ Lepsze zarządzanie pamięcią
✔ Dokładne obliczanie obszaru wartości
✔ Poprawne pozycjonowanie profilu sesji
✔ Lepsza wydajność przełączania
✔ Kompatybilność międzyplatformowa
✔ Sesje oparte na UTC (bez automatycznego czasu letniego)
✔ Ulepszone obsługiwanie naked POC
✔ Ulepszone renderowanie profilu
🧭 Zastosowania handlowe
🔹 Analiza aukcji intraday — Identyfikuj, gdzie kształtuje się, migruje lub przełamuje wartość.
🔹 Transakcje odwrócenia POC i wartości — Celuj w retesty równowagi lub zanikanie ekstremów.
🔹 Wybicia początkowego balansu — Wykrywaj moment, gdy sesja rozszerza się poza zakres pierwszej godziny.
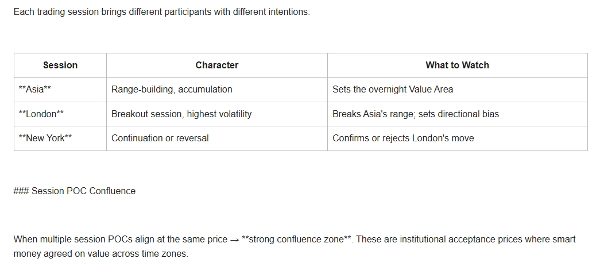
🔹 Badanie rotacji sesji — Porównuj profile między sesjami Azji, Londynu i Nowego Jorku z uwzględnieniem stref czasowych.
🔹 Budowanie kontekstu instytucjonalnego — Łącz z narzędziami wolumenu lub delty, aby potwierdzić ślady inteligentnych pieniędzy.
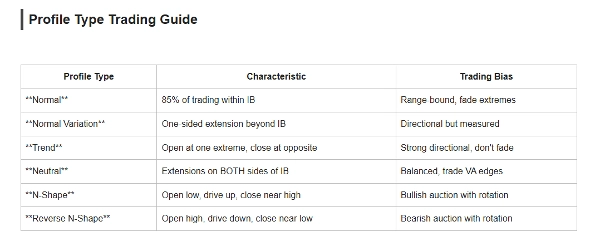
Typy profili
Typ Warunki rynkowe
Normalny Zrównoważony rynek
Normalna wariacja Umiarkowany trend
Trend Silny dzień kierunkowy
Neutralna aukcja dwustronna
Aukcja bycza w kształcie litery N
Aukcja niedźwiedzia w odwróconym kształcie litery N
Idealne dla
- Teoria rynku aukcyjnego (AMT)
- Traderzy Market Profile
- Traderzy intraday
- Traderzy swingowi
- Traderzy futures
- Traderzy forex
- Profesjonalna analiza przepływu zleceń
Wprowadź instytucjonalną klarowność do swoich wykresów.
Wskaźnik Market Profile TPO przekształca surowe dane cenowe w opowieść o wartości, nierównowadze i okazji
Zastrzeżenie: Ten wskaźnik jest dostarczany wyłącznie w celach edukacyjnych i informacyjnych i nie stanowi porady finansowej, inwestycyjnej ani handlowej. Market Profile to narzędzie analityczne i nie gwarantuje zysków ani przyszłych wyników.
Handel na rynkach finansowych wiąże się z dużym ryzykiem, a wyniki z przeszłości nie gwarantują przyszłych rezultatów. Użytkownicy ponoszą pełną odpowiedzialność za swoje decyzje handlowe, zarządzanie ryzykiem oraz wszelkie zyski lub straty.
Zawsze przeprowadzaj własną analizę i konsultuj się z wykwalifikowanym specjalistą finansowym przed podjęciem decyzji inwestycyjnych lub handlowych.
Podsumowanie
Key features include multiple TPO display modes (letters and histogram), session and timezone intelligence with UTC-based sessions, open/close price markers (O/X), single prints, naked POC/VA levels, and overlays of day and previous day OHLC data. The indicator supports analysis of various market conditions through profile types like Normal (balanced market), Normal Variation (moderate trend), Trend (strong directional day), Neutral (two-sided auction), N-Shape (bullish auction), and Reverse N-Shape (bearish auction).
It is suitable for professional day traders, auction market analysts, order flow enthusiasts, and traders across Forex, indices, and commodities markets. Typical use cases include intraday auction analysis, POC and value reversion trades, initial balance breakouts, session rotation studies, and institutional context building when combined with volume or delta tools.
This indicator provides a detailed, structured view of market dynamics to support informed trading decisions based on Auction Market Theory and Market Profile principles.
Opinie klientów
5 | 0 % | |
4 | 100 % | |
3 | 0 % | |
2 | 0 % | |
1 | 0 % |


