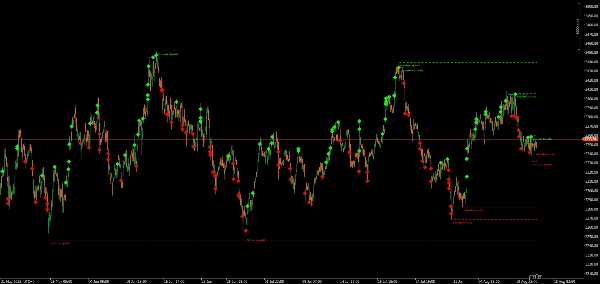
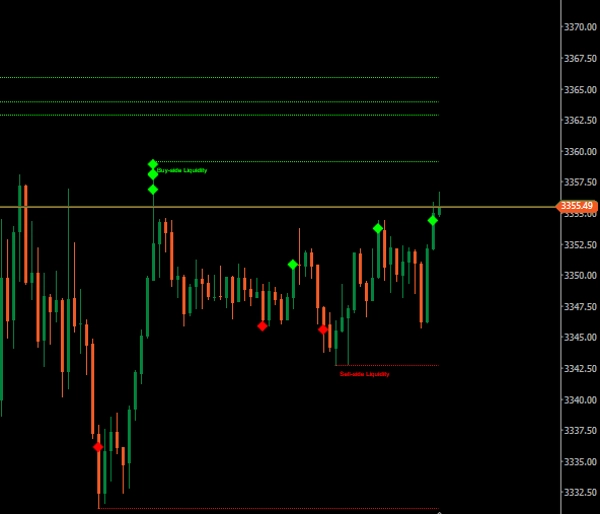
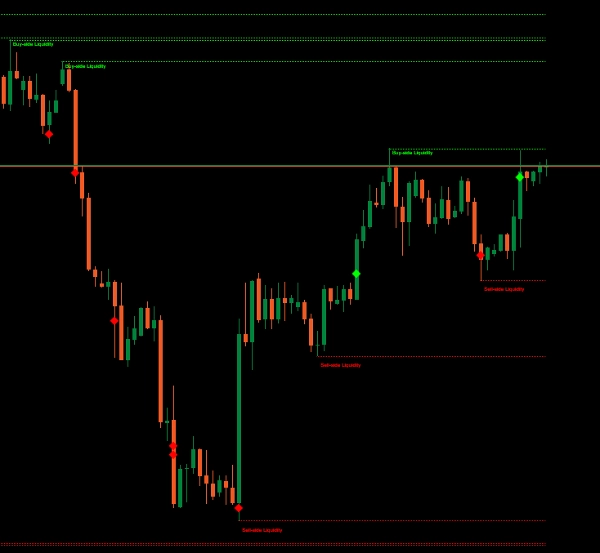
อินดิเคเตอร์
NAS100
Indices
XAUUSD
Commodities
Forex
EURUSD
BTCUSD
BSL_SSL_Liqudity
"BSL_SSL_Liqudity" โลโก้
02/11/2025
3
Desktop
"BSL_SSL_Liqudity" ภาพที่อัปโหลด"BSL_SSL_Liqudity" ภาพที่อัปโหลด"BSL_SSL_Liqudity" ภาพที่อัปโหลด

The Buy-Side & Sell-Side Liquidity (BSL/SSL) Indicator is designed for traders who follow (ICT) or liquidity-based strategies. It automatically detects key liquidity zones in the market—highlighting swing highs (Buy-Side Liquidity) and swing lows (Sell-Side Liquidity)—and monitors whether these levels have been swept or remain intact.

  1. BSL (Buy-Side Liquidity) – Marks recent swing highs where stop-loss orders from short positions or breakout buy orders may be clustered.
  2. SSL (Sell-Side Liquidity) – Marks recent swing lows where stop-loss orders from long positions or breakout sell orders may be sitting.
  3. Swept Markers – When price breaches a marked liquidity level, the indicator plots a diamond marker to show the sweep.

Who Is It For?

  • ICT Methodology Traders
  • Liquidity Grab / Stop Hunt Strategists
  • Scalpers & Day Traders targeting session-based moves
  • Swing Traders looking for high-probability reversal points

Benefits

  • Visual clarity – Instantly see where the market is likely to seek liquidity.
  • Time efficiency – No more manually marking swings and checking for sweeps.


  • Strategic advantage – Combine with
  • FVGs,
  • market structure to refine trade setups.
  • Session kill zones
  • macros


My Other Products


Disclaimer: Trading involves risk, and past results do not guarantee future performance. Use proper risk management, follow stop-loss levels, and trade responsibly. I am not liable for any financial losses from using these algorithms.use these indicators for your confluence and reduce burden your charting markup time

0.0
รีวิว: 0
รีวิวจากลูกค้า
ยังไม่มีรีวิวสำหรับผลิตภัณฑ์นี้ หากเคยลองแล้ว ขอเชิญมาเป็นคนแรกที่บอกคนอื่น!
เพิ่มเติมจากผู้เขียนคนนี้
อินดิเคเตอร์
NAS100
XAUUSD
Commodities
+10
MARKET_STRUCTURE BOS_CHoCH
MarketStructurePro – Smart BOS/CHoCH
Institutional FVG Zones MTF with Confluence
Professional Fair Value Gaps with multitimeframe spot on
VWAP & Sessions & D,W,M HLO Levels
Killzone Session With VWAP – Precision Meets Price Action
Fair Value Gaps_FVG_MTF
Multi-TF FVG + Smart Fibonacci
Market_Session_Forex
Market Sessions
All-in-One Session Levels Suite
Institutional Session Levels Pro OHLC,Prev(D,W,M OHLC)
Multi_TF Candlestick Chart Overlay
Perfect for traders who demand a clear overview of multiple timeframes at a glance.
ยอดนิยม
$ 15
/
$25
TDI_Pro
Traders Dynamic Index (TDI) — Divergence Edition
VWAP_MTF
📊 VWAP with MTF & Dynamic Deviation Bands
ICT Killzones & Macros
KILLZONES AND MACRO SESSIONS
ICT_SMC_ToolKit
institutional-level market analysis
นอกจากนี้คุณยังอาจชอบ
เรตติ้งสูง
ฟรี
BreakOut_Probability_Expo
Break Out Probability Experimental indicator. Credits for this indicator goes to Zeiierman !!!
Coral Filter Lite
🐠 Free trend baseline - without the noise. Free limited version of Coral Filter X Pro 🐠
Supertrend Indicator v1.1
SUPERTREND INDICATOR v1.1
ยอดนิยม
$ 17
TS_Pivot
Those who are involved in trading know how important it is to take into account the previous session. With Order Block
เรตติ้งสูง
ฟรี
RSI Trend Trigger
RSI Trend Trigger 📈: Uses dual-layer RSI to spot trends & generate clear buy/sell signals.
Zero Lag MACD
Zero Lag MACD delivers ultra-responsive trend and divergence signals with minimal lag, empowering timely Forex entries.
Automatic Fibonatti
Automatically plots Fibonacci retracement levels using the highest and lowest points of a customizable time range
Round Numbers
Automatically draws major, minor, and trace support/resistance levels at round numbers
Goldenhours
The Session Golden Hours indicator is designed for serious traders looking to visualize high-probability
VegaXLR - Unlimited Trendline Alerts
This is an indicator that can alert you about trendlines, horizontal lines and vertical lines.
AlgoCorner DonchianPSAR
Visualize market asymmetry like never before — steady climbs meet sudden drops with the Donchian PSAR
Ichimoku Kinko Hyo
Ichimoku Kinkō Hyō with fixed shift to 25 as Ctrader calculate it from 0 and values was wrong for Chikou Span and Kumo.
MACD Plus
A visually enhanced MACD with colored histograms to clearly show trend strength.
Renko Moving Average Cross Indicator
The Renko Moving Average Cross indicator combines classic EMA crossover signals with Renko-filtered prices.
อินดิเคเตอร์
NAS100
NZDUSD
Martingale
+26
Daily TPO profile
Daily TPO profile indicator that calculates POC, VAH and VAL for each session. Plots the Point of Control and the 70% Va
Advanced Market Structure Bos,Choch,SwinLevels, Order Blog
Advanced price action tool that combines multiple technical analysis concepts