TDI_Pro
Indicator
3 purchases
Version 1.0, Aug 2025
Windows, Mac
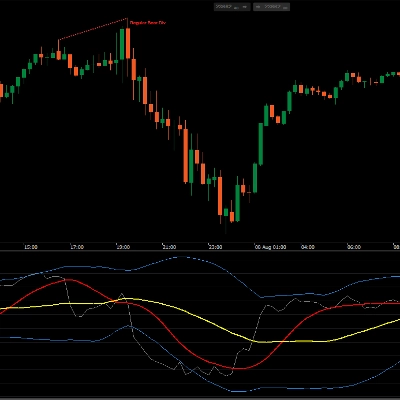
A professional TDI - combines RSI, moving-average smoothing, and Bollinger Bands with automatic Regular & Hidden divergence detection. Draws divergence lines in the TDI pane and (optionally) on the price chart for crystal-clear context.
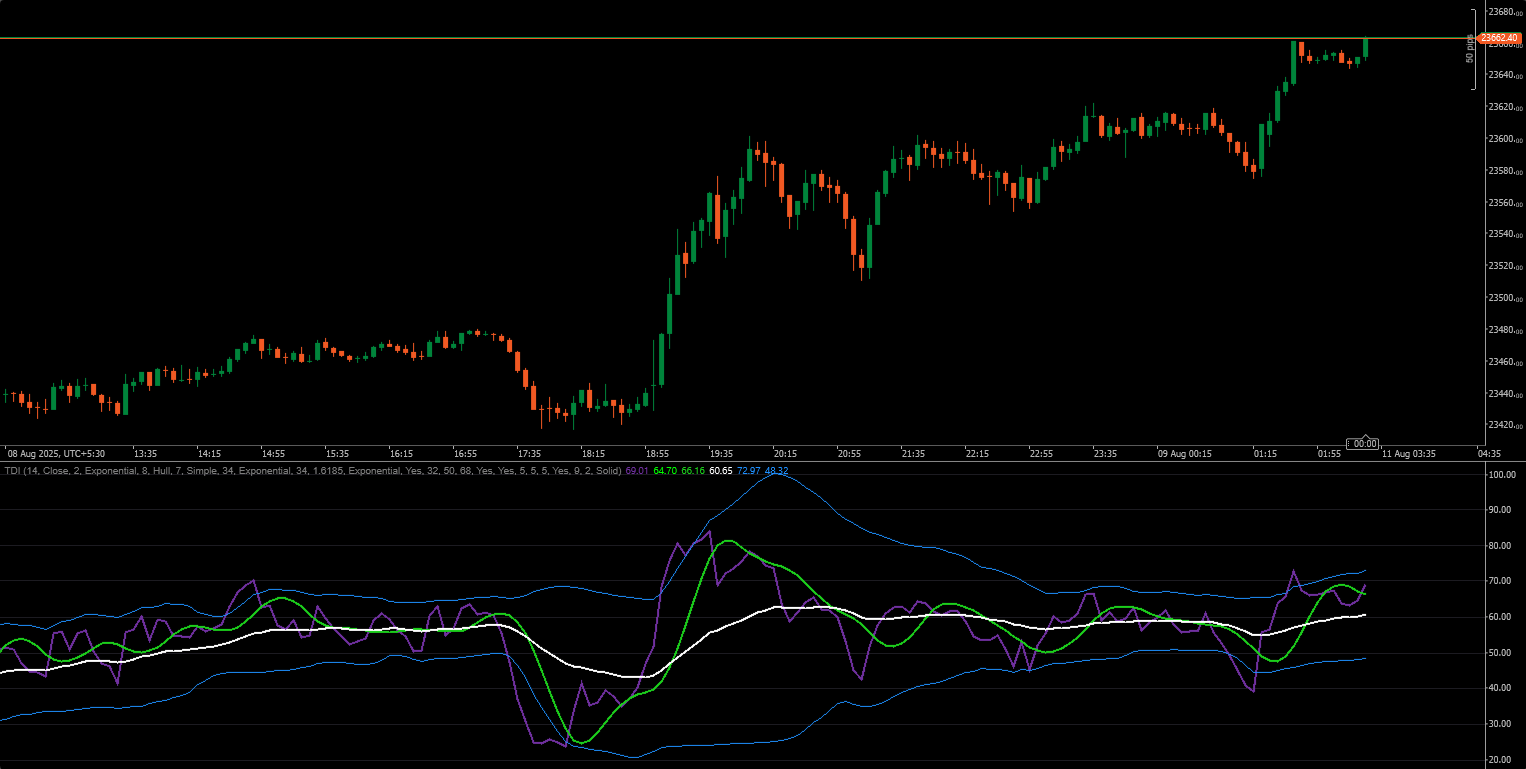
- Full TDI suite: Price Line (green), Signal Line (red), Market Base Line (yellow), RSI bands.
- Volatility Bands: Bollinger Bands applied to RSI (period & deviations configurable).
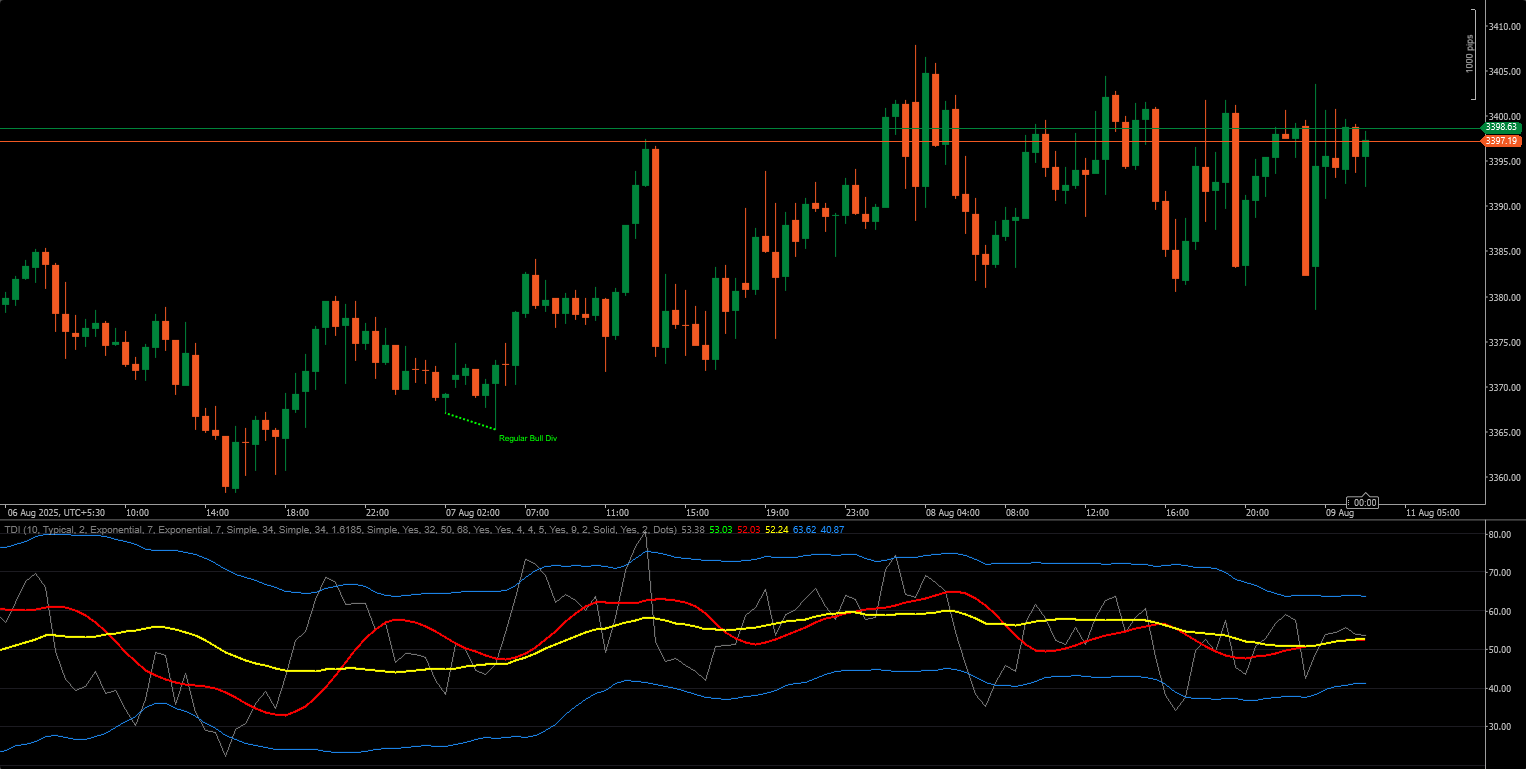
- Divergence engine: Detects Regular (reversal) and Hidden (trend-continuation) divergences.
- On-chart visuals: Toggle to draw divergence lines/labels directly on the price chart.
- Precision pivots: User-controlled swing pivots (Left/Right bars) + minimum bar spacing.
Change log
- v1.0 – Initial release: full TDI + Regular/Hidden divergence detection, on-chart drawing, guide levels, rich styling controls.
Disclaimer: This tool is for educational/analytical purposes only. Trading involves risk. Use proper risk management and test on demo before going live.
My Other Products
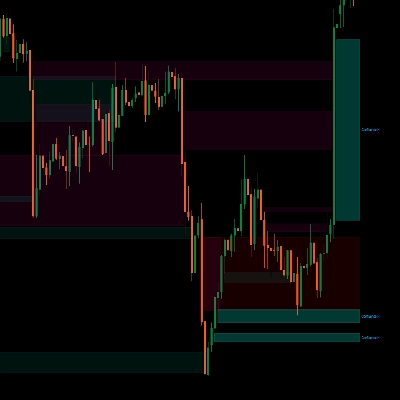
- Institutional FVG Zones MTF with Confluence
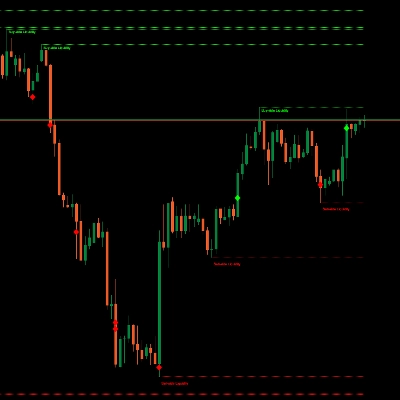
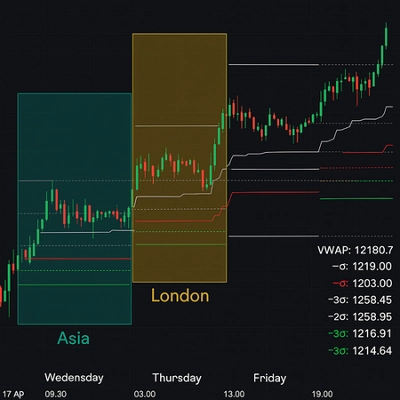
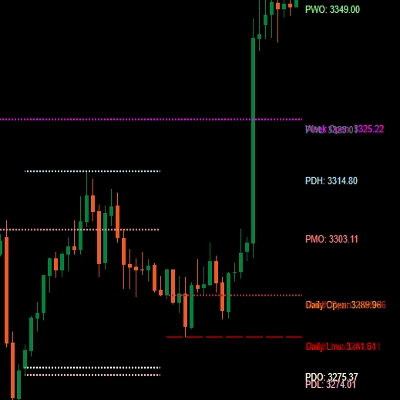
- All-in-One Session Levels Suite
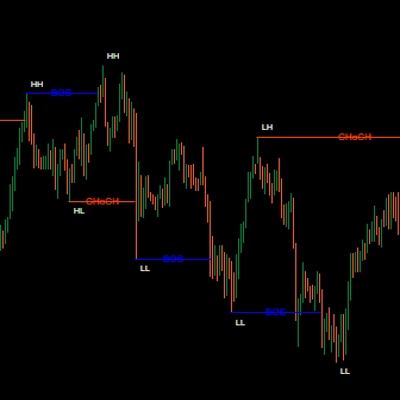
- MARKET_STRUCTURE BOS_CHoCH
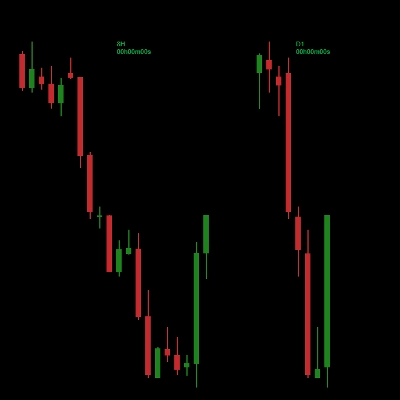
- Multi_TF Candlestick Chart Overlay
- ICT Killzones & Macros
- ICT_SMC_ToolKit
- VWAP_MTF
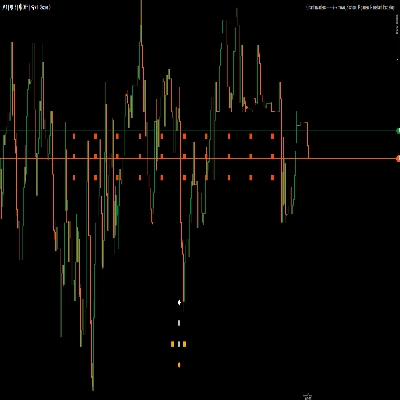
- Traders Dynamic Index (TDI)
- Market_Session_Forex
Disclaimer: Trading involves risk, and past results do not guarantee future performance. Use proper risk management, follow stop-loss levels, and trade responsibly. I am not liable for any financial losses from using these algorithms.use these indicators for your confluence and reduce burden your charting markup time
Indicator profile
0.0
Reviews: 0
Customer reviews
No reviews for this product yet. Already tried it? Be the first to tell others!
NAS100
RSI
Breakout
XAUUSD
Commodities
Forex
Signal
EURUSD
GBPUSD
BTCUSD
Indices
Prop
Stocks
Crypto
Scalping
Products available through cTrader Store, including indicators, plugins and cBots, are provided by third-party developers and made available for informational and technical access purposes only. cTrader Store is not a broker and does not provide investment advice, personal recommendations or any guarantee of future performance.
More from this author

You may also like


Since 22/06/2025
40
Sales
42
Free installs