Description
Most trend indicators answer the same question the same way: smooth the price, draw some lines, look for crossovers. The FDQ Price Channel was built around a different question — what is the price actually doing, stripped of noise and drift, and what does that tell you about where it is likely to go?
The result is a channel-based trend indicator that combines three distinct analytical layers into a single, readable overlay.
- Key Points
A Different Starting Point. The price series most indicators use is, statistically, a problem.
Raw prices carry a random walk component that obscures meaningful structure. Before any channel is drawn, FDQ applies a fractional differentiation transform — a technique borrowed from quantitative research — that removes this drift while deliberately preserving long-range memory in the data. What remains is a transformed series that still reflects where the market has been, but is no longer dominated by where it currently is. This is the foundation everything else is built on.
- Noise Has a Cost
Every lag-based smoothing method trades timing for accuracy. Kalman filtering does not.
The Kalman filter is a recursive estimation process: it continuously updates its view of the market, balancing how much to trust the new data versus what it has already established. Unlike a moving average, it has no fixed lookback window and does not treat all past bars equally. The output is a cleaner representation of price that responds quickly to genuine moves and resists reacting to noise — without the delayed signals that smoothing typically produces.
- Bands Built from Behavior, Not Formula
Standard deviation bands assume price is normally distributed. It rarely is.
The FDQ channel bounds are defined using quantile analysis — the actual statistical distribution of the transformed price over the lookback period. The high band marks the level the series genuinely reaches at the upper extreme of its range; the low band does the same at the lower extreme. These are not theoretical boundaries calculated from a mean — they reflect where price has actually traded, which makes them more responsive to how the market is truly behaving at any given time.
- A Second Layer Inside the Channel
The outer bands define the range. The inner bands define the zone.
A second set of bands sits proportionally between the outer channel and its midline. This inner layer creates a distinct trading zone — narrower than the full channel, anchored to the same statistical foundation — that serves as a graduated reference for entries and signal classification.
- Trend State Before Everything Else
A signal without context is just random data.
The indicator tracks the directional state of the channel continuously, using a majority-vote mechanism across the three band components. When at least two of the three are moving in the same direction, the trend state is confirmed as Rising or Falling. Signals are only generated in alignment with the current state — long setups only in Rising conditions, short setups only in Falling. When the market does not meet this threshold, no state is declared and no signals are generated. The transitions between states are marked as vertical lines directly on the chart.
- Three Distinct Rebound Setups
Not all pullbacks are equal. The indicator recognizes three gradations.
Once a trend state is active, the indicator watches for specific rebound patterns — moments where price has moved against the trend, touched a defined level, and reversed back through it.
- Mid Rebound — Price dips below (or rises above) the channel midline and recovers. A standard pullback within a trend.
- Deep Rebound — Price extends further, reaching the inner band extreme before recovering. A more committed pullback with a more decisive reversal.
- Light Rebound — Price touches the inner band on the trend side and snaps back. The shallowest of the three, occurring most frequently.
Each type is visually distinct on the chart and can be enabled or disabled independently.
- What You See
The chart tells the story directly, without interpretation.
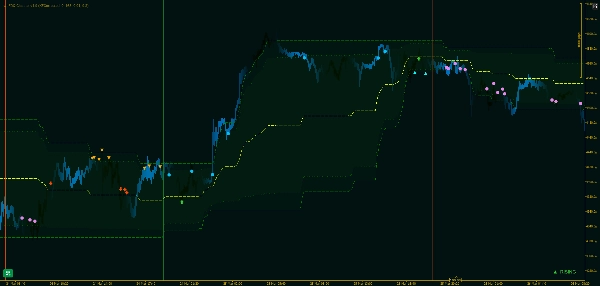
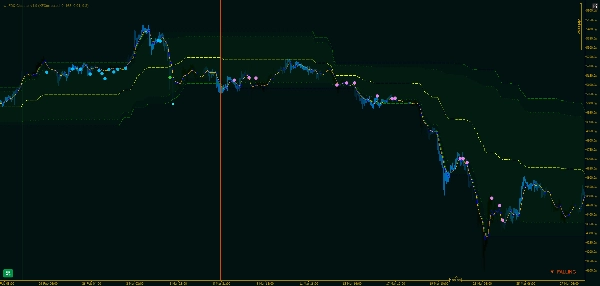
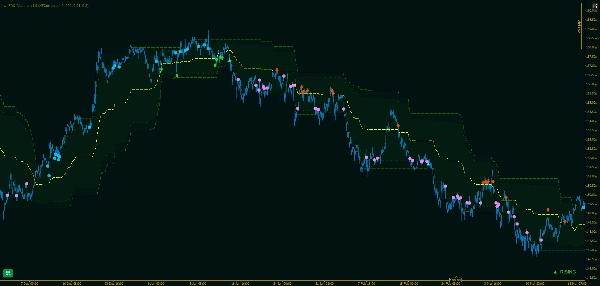
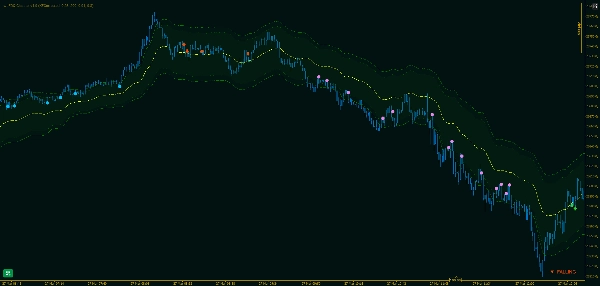
The primary channel, inner bands, and midline overlay price as continuous lines. Regime transitions are marked with vertical lines — green for Rising, red for Falling — so the history of trend state changes is visible at a glance. Signal markers appear at the bar where each rebound is confirmed, with separate icons for each signal type and direction.
- Why This Approach Holds Up
Most channel indicators lag when markets move fast and over-react when they do not.
Because the FDQ channel is built on a stationary, memory-preserving transform rather than a rolling average, the bands adjust to the distribution of actual behavior rather than chasing price. The Kalman layer keeps the underlying estimate clean without introducing the timing cost that comes with windowed smoothing. The result is a channel that stays meaningful across different market conditions — trending, ranging, and transitional — without needing manual adjustment.
Summary
The channel boundaries are defined by quantile analysis of the transformed price distribution rather than standard deviation, capturing actual price extremes over the lookback period. It features outer bands marking the full range and inner bands creating a narrower trading zone for refined entry signals. The indicator continuously tracks trend direction using a majority vote across three band components, confirming Rising or Falling states and marking transitions with vertical lines on the chart.
Within active trends, wt.FDQ Channel identifies three distinct rebound setups—Light, Mid, and Deep—each representing different pullback intensities and reversal confirmations. These signals are visually distinct and configurable. The overlay displays the primary channel, inner bands, midline, trend states, and rebound signals directly on the price chart, supporting analysis across various markets including Forex, indices, and cryptocurrencies.
Customer reviews
5 | 100 % | |
4 | 0 % | |
3 | 0 % | |
2 | 0 % | |
1 | 0 % |