
คำอธิบาย
ปลดล็อกข้อมูลเชิงลึกของการเคลื่อนไหวราคาที่ทรงพลังด้วยตัวบ่งชี้แบบครบวงจรนี้ — ตรวจจับช่องว่างมูลค่ายุติธรรม (FVGs) อัตโนมัติในหลายกรอบเวลาและเน้นโซนความสอดคล้องที่ทรงพลังโดยตรงบนแผนภูมิของคุณ!
คุณสมบัติหลัก:
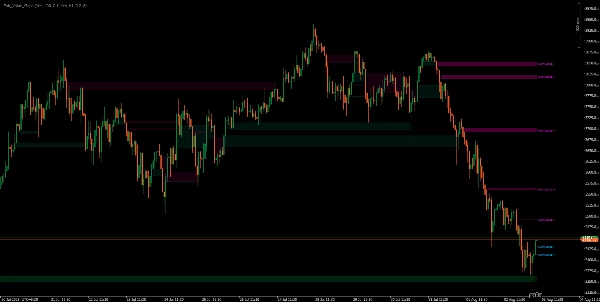
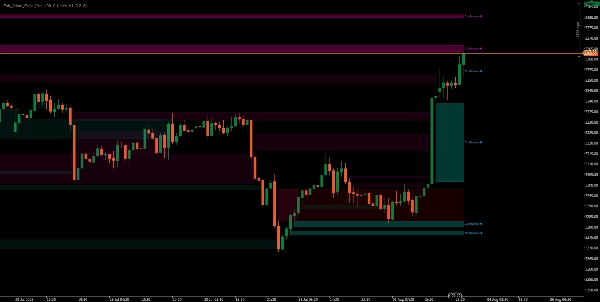
- การตรวจจับ FVG หลายกรอบเวลา: แสดงช่องว่างมูลค่ายุติธรรมจากกรอบเวลาที่สูงกว่าและต่ำกว่าในเวลาเดียวกัน เพื่อให้คุณเห็นความไม่สมดุลและโซนสภาพคล่องที่สำคัญได้อย่างรวดเร็ว
- เน้นโซนความสอดคล้อง: เห็นทันทีว่าช่องว่าง FVG จากกรอบเวลาต่างๆ ทับซ้อนกันที่ไหน — นี่คือ “โซนร้อน” ที่เทรดเดอร์สถาบันจับตามอง!
- ปรับแต่งสี FVG ความทึบ และขนาดป้ายชื่อได้: ปรับการแสดงผลให้เหมาะสมสำหรับการมองเห็นและสไตล์ที่สมบูรณ์แบบ
- หยุดเติมอัตโนมัติ: โซน FVG จะถูกลบโดยอัตโนมัติเมื่อราคากรอกช่องว่าง ทำให้แผนภูมิของคุณสะอาดและเกี่ยวข้อง
- ป้ายชื่อบนแผนภูมิ: แต่ละช่องว่างจะแสดงป้ายชื่อสั้นๆ พร้อมกรอบเวลาต้นทาง
- การออกแบบระดับมืออาชีพ: น้ำหนักเบา มีประสิทธิภาพ และเข้ากันได้เต็มที่กับสัญลักษณ์หรือกรอบเวลาใดๆ
เหมาะสำหรับ:
- เทรดเดอร์ SMC, ICT และ orderflow
- เทรดเดอร์รายวันและสวิงที่ต้องการระบุโซนความไม่สมดุลที่ดีที่สุด
- ใครก็ตามที่ต้องการเพิ่มเครื่องมือความสอดคล้องที่ทรงพลังในกระบวนการทำงานของการเคลื่อนไหวราคา
**อย่าเทรดทุก FVG (ความไม่สมดุล) — เทรดเฉพาะที่สำคัญ!**
สังเกตและดำเนินการกับความไม่สมดุลของสภาพคล่องที่สำคัญที่สุดที่หลายกรอบเวลาสอดคล้องกัน
ผลิตภัณฑ์อื่นๆ ของฉัน
- Institutional FVG Zones MTF with Confluence
- All-in-One Session Levels Suite
- MARKET_STRUCTURE BOS_CHoCH
- Multi_TF Candlestick Chart Overlay
- ICT Killzones & Macros
- ICT_SMC_ToolKit
- VWAP_MTF
- Traders Dynamic Index (TDI)
- Market_Session_Forex
ข้อจำกัดความรับผิดชอบ: การซื้อขายมีความเสี่ยง และผลลัพธ์ในอดีตไม่รับประกันผลลัพธ์ในอนาคต ใช้การจัดการความเสี่ยงที่เหมาะสม ปฏิบัติตามระดับหยุดขาดทุน และเทรดอย่างมีความรับผิดชอบ ฉันไม่รับผิดชอบต่อความสูญเสียทางการเงินใดๆ จากการใช้สูตรเหล่านี้ ใช้ตัวบ่งชี้เหล่านี้เพื่อความสอดคล้องและลดภาระเวลาการทำเครื่องหมายแผนภูมิของคุณ
สรุป
Key features include customizable colors, opacity, and label sizes for FVG visualization, automatic removal of filled gaps to maintain chart clarity, and on-chart labels indicating the originating timeframe of each gap. The indicator is lightweight, efficient, and compatible with any symbol or timeframe.
This tool is suited for Smart Money Concepts (SMC), Inner Circle Trader (ICT), and order flow traders, as well as day and swing traders seeking to pinpoint critical imbalance zones. It supports markets including Forex, Indices, and Commodities. The indicator aims to assist traders in focusing on the most significant liquidity imbalances where multiple timeframes align, enhancing confluence in price action analysis.
รีวิวจากลูกค้า
5 | 100 % | |
4 | 0 % | |
3 | 0 % | |
2 | 0 % | |
1 | 0 % |


