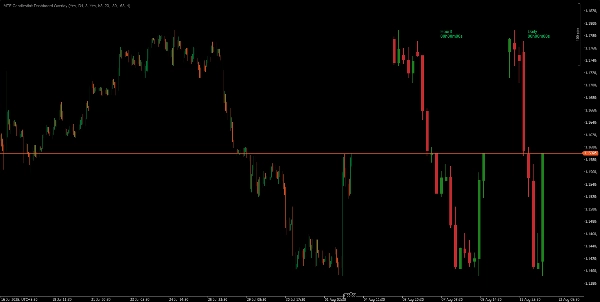
Multi_TF Candlestick Chart Overlay
Logo de "Multi_TF Candlestick Chart Overlay"
21/08/2025
1
Desktop
Since 22/06/2025
Ventes
12
Free installs
6

This indicator overlays bold, easy-to-read candlestick panels from two higher timeframes—fully configurable—directly on your chart. Instantly visualize higher timeframe market structure, trend, and momentum without switching charts.

Features:
• Display two customizable panels (any timeframes) side-by-side
• Real-time countdown timer for each TF’s next candle
• Clean, filled candles with bull/bear coloring and bold wicks
• User controls for panel position, size, spacing, and candle count
• Zero lag, works on any chart timeframe or symbol

Perfect for traders who demand a clear overview of multiple timeframes at a glance.

Never miss a key HTF structure shift again—see the big picture right on your trading chart!


My Other Products


Disclaimer: Trading involves risk, and past results do not guarantee future performance. Use proper risk management, follow stop-loss levels, and trade responsibly. I am not liable for any financial losses from using these algorithms.use these indicators for your confluence and reduce burden your charting markup time

Plus de cet auteur
Tiny_Aim_Trainer
trading stress-relief “mini-game”
Indicateur
NAS100
XAUUSD
Commodities
+10
MARKET_STRUCTURE BOS_CHoCH
MarketStructurePro – Smart BOS/CHoCH
Retro_Shooting_Game
trading stress-relief “mini-game”
Indicateur
NAS100
Indices
XAUUSD
+4
BSL_SSL_Liqudity
Buy-Side & Sell-Side Liquidity (BSL/SSL) Indicator
Indicateur
Indices
Commodities
Forex
Institutional FVG Zones MTF with Confluence
Professional Fair Value Gaps with multitimeframe spot on
Market_Session_Forex
Market Sessions
Indicateur
VWAP
Breakout
Scalping
VWAP & Sessions & D,W,M HLO Levels
Killzone Session With VWAP – Precision Meets Price Action
Indicateur
NAS100
Indices
XAUUSD
+7
Fair Value Gaps_FVG_MTF
Multi-TF FVG + Smart Fibonacci
Indicateur
NAS100
Indices
Prop
+6
ICT_SMC_ToolKit
institutional-level market analysis
ICT Killzones & Macros
KILLZONES AND MACRO SESSIONS
VWAP_MTF
📊 VWAP with MTF & Dynamic Deviation Bands
Indicateur
NAS100
Indices
Breakout
+6
All-in-One Session Levels Suite
Institutional Session Levels Pro OHLC,Prev(D,W,M OHLC)
TDI_Pro
Traders Dynamic Index (TDI) — Divergence Edition
Vous pourriez aussi aimer
Indicateur
Indices
Breakout
Stocks
+3
Ichimoku Cloud Indicator
The Ichimoku Cloud is a comprehensive technical analysis system developed by Japanese journalist Goichi Hosoda
Indicateur
RSI
Breakout
XAUUSD
+5
Dynamic Range MomentumI
This histogram helps visualize the strength and direction of market movements, making it easier to spot potential trends
Indicateur
Indices
Breakout
Commodities
+3
Trend Lines Auto - FXMaster
Auto Trend Line Indicator for cTrader
Indicateur
Indices
Stocks
Commodities
+2
SymbolTFOverlay
The SymbolTFOverlay display the current symbol and timeframe as a semi-transparent text overlay on the chart.
Les mieux notés
Gratuit
Indicateur
ATR
Forex
Signal
+4
Follow Line
The Follow Line Indicator is a versatile tool designed to identify market trends and provide accurate buy/sell signals.
MMXM Structure by Ludwig
MMXM Structure by LudwigICT – Professional Market Structure Mapping Tool
Indicateur
Breakout
ORB v1.1
Opening Range Breakout v1.1 - Visuals + Stats
Les mieux notés
Gratuit
FairValueGap
This Fair Value Gap (FVG) indicator is a technical analysis tool used to identify potential price imbalances.
Buy and sell indicator
Buy and Sell Signals
Indicateur
Stocks
Forex
Crypto
+1
Market Structure SNR + Auto Bias
Market Structure Indicator – Your Trading Map in a Noisy Market. No more Panicking Which one, Where, Why and How.
Indicateur
RSI
XAUUSD
Breakout
+4
S&R Structural ZigZag
"Detects swings 🎯, draws zigzag trends 📈📉, support/resistance ⏹️, labels HH/HL/LH/LL, Tracks market structure 🚀🐻."
Indicateur
Stocks
Forex
Signal
+1
Engulfing Pattern Indicator
Indicateur
Indices
XAUUSD
Prop
+8
Average Cost Price
Average Cost Price helps you keep track of your open positions on the chart. In doing so, it provides lines and explanat
VegaXLR - RSI and StochRSI Alerts
VegaXLR's cTrader StochRSI identifies overbought/oversold RSI levels for precise trade entries.
VegaXLR - Candlestick Patterns Alerts
Real-Time Candlestick Pattern Detection with Custom Alerts & Trend Analysis for cTrader
Indicateur
RSI
Signal
MACD
[Stellar Strategies] Moving Averages Combined 1.0
Smooths price action with 6 MAs (3 SMA, 3 EMA). Reduces noise, clarifies trends 📈📉
LT Flexible Volume Profile
Flexible Volume Profile, designed with performance in mind.
IR Macd + MacdLine
some user add moving average to macd to see better. in ctrader 4.3.11 there is a problem with this . I make a macd tha