
Description
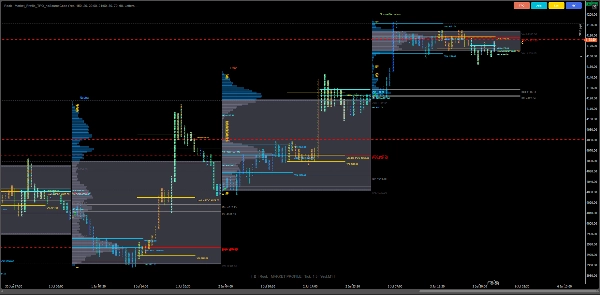
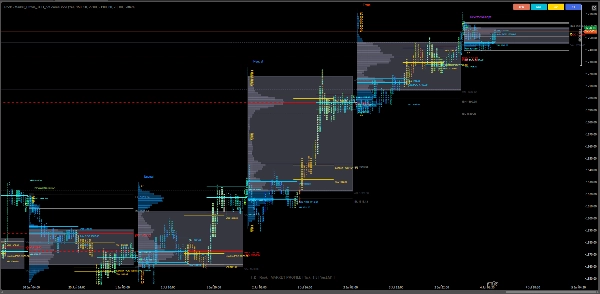
Market Profile TPO (Time Price Opportunity) apporte une visualisation de la structure du marché de qualité institutionnelle à cTrader — permettant aux traders de voir comment le prix, le temps et le volume interagissent à travers les sessions dans une vue intelligente unique.
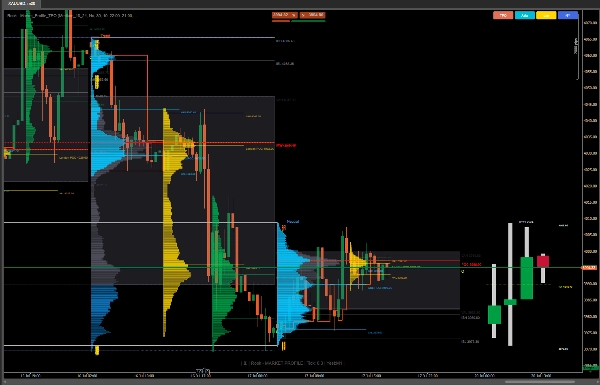
Conçu pour les traders professionnels intrajournaliers, les analystes du marché aux enchères et les passionnés de flux d’ordres, cet indicateur offre une vraie représentation de l’activité du marché utilisant des lettres TPO, des boîtes et des histogrammes. Il vous aide à identifier les zones de valeur, les zones POC, les plages d’équilibre initial et les niveaux nus avec une précision extrême.
⚙️ Fonctionnalités principales
✅ Visualisation (TPO)
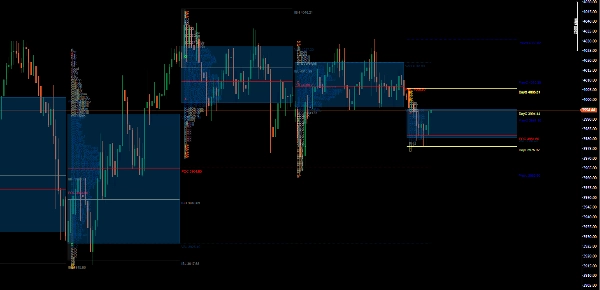
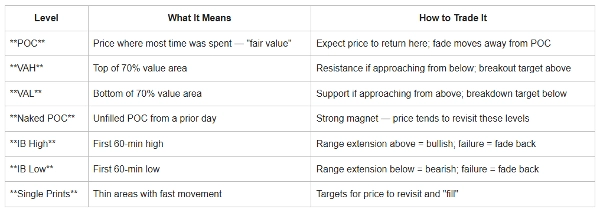
✅ Zones POC & Zone de valeur
✅ POC en développement
✅ Détection de l’équilibre initial (IB)
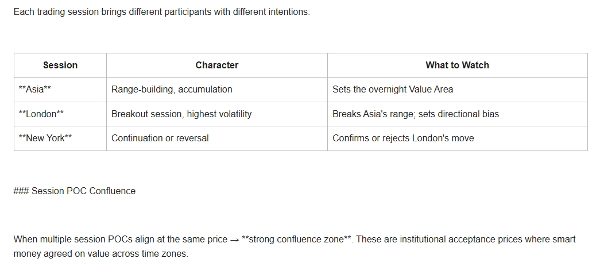
✅ Intelligence des sessions & fuseaux horaires
✅ Modes d’affichage TPO (Lettres / Histogramme)
✅ Marqueurs de prix d’ouverture/fermeture (O/X)
✅ Impressions simples & niveaux POC/VA nus
✅ Superposition OHLC du jour & du jour précédent
✅ Superposition OHLC du jour & du jour précédent
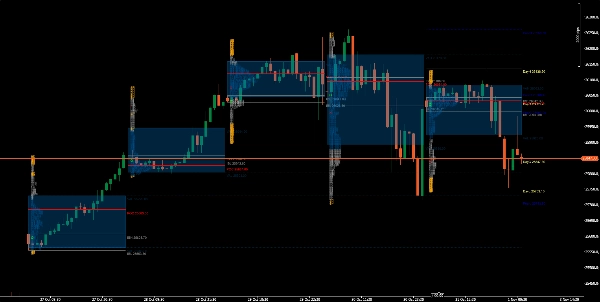
✅ Projection de barre HTF (AMD)
Améliorations majeures
✔ Chargement plus rapide
✔ Meilleure gestion de la mémoire
✔ Calcul précis de la zone de valeur
✔ Positionnement correct du profil de session
✔ Meilleure performance du basculement
✔ Compatibilité multiplateforme
✔ Sessions basées sur UTC (pas de DST automatique)
✔ Gestion améliorée du POC nu
✔ Rendu amélioré du profil
🧭 Cas d’utilisation en trading
🔹 Analyse des enchères intrajournalières — Identifier où la valeur se forme, migre ou se casse.
🔹 Trades de reversion POC & valeur — Cibler les retests d’équilibre ou l’atténuation des extrêmes.
🔹 Breakouts d’équilibre initial — Repérer quand la session s’étend au-delà de sa plage de première heure.
🔹 Étude de rotation des sessions — Comparer les profils entre les sessions Asie, Londres et New York avec alignement des fuseaux horaires.
🔹 Construction de contexte institutionnel — Combiner avec des outils de volume ou delta pour valider les empreintes de l’argent intelligent.
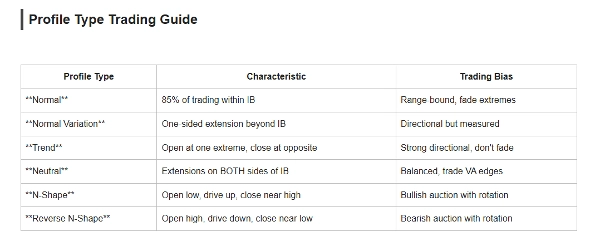
Types de profils
Type Condition du marché
Normal Marché équilibré
Variation normale Tendance modérée
Tendance Journée directionnelle forte
Neutre Enchère bilatérale
Enchère haussière en forme de N
Enchère baissière en forme de N inversé
Idéal pour
- Théorie du marché aux enchères (AMT)
- Traders Market Profile
- Traders intrajournaliers
- Traders swing
- Traders futures
- Traders Forex
- Analyse professionnelle du flux d’ordres
Apportez une clarté institutionnelle à vos graphiques.
L’indicateur Market Profile TPO transforme les données brutes de prix en une histoire de valeur, de déséquilibre et d’opportunité
Avertissement : Cet indicateur est fourni à des fins éducatives et informatives uniquement et ne constitue pas un conseil financier, d’investissement ou de trading. Market Profile est un outil analytique et ne garantit pas de profits ni de résultats futurs.
Le trading sur les marchés financiers comporte des risques importants, et les performances passées ne garantissent pas les résultats futurs. Les utilisateurs sont seuls responsables de leurs décisions de trading, de la gestion des risques et de tout profit ou perte en résultant.
Effectuez toujours votre propre analyse et consultez un professionnel financier qualifié avant de prendre des décisions d’investissement ou de trading.
Résumé
Key features include multiple TPO display modes (letters and histogram), session and timezone intelligence with UTC-based sessions, open/close price markers (O/X), single prints, naked POC/VA levels, and overlays of day and previous day OHLC data. The indicator supports analysis of various market conditions through profile types like Normal (balanced market), Normal Variation (moderate trend), Trend (strong directional day), Neutral (two-sided auction), N-Shape (bullish auction), and Reverse N-Shape (bearish auction).
It is suitable for professional day traders, auction market analysts, order flow enthusiasts, and traders across Forex, indices, and commodities markets. Typical use cases include intraday auction analysis, POC and value reversion trades, initial balance breakouts, session rotation studies, and institutional context building when combined with volume or delta tools.
This indicator provides a detailed, structured view of market dynamics to support informed trading decisions based on Auction Market Theory and Market Profile principles.
Avis clients
5 | 0 % | |
4 | 100 % | |
3 | 0 % | |
2 | 0 % | |
1 | 0 % |


