
Description
Indicateur de Swing Haut / Bas & Rupture de Structure
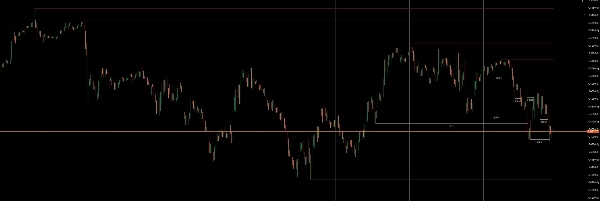
Structure de Marché Propre détecte automatiquement les Swing Hauts et Swing Bas et trace des niveaux dynamiques de Support et Résistance basés sur une structure de pivot confirmée.
Les niveaux s'étendent dans le temps jusqu'à ce que le prix les casse. Lorsqu'une Rupture de Structure (BOS) se produit, le niveau est converti en une ligne historique avec une étiquette de rupture, permettant aux traders d'identifier rapidement les changements structurels et les balayages de liquidité.
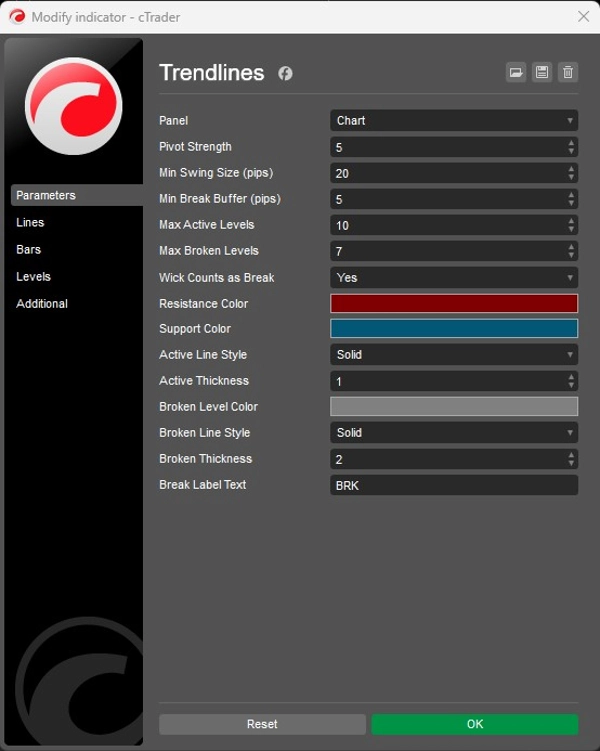
L'indicateur inclut des filtres tels que la taille minimale du swing et les marges de rupture pour ignorer les pivots insignifiants et se concentrer uniquement sur la structure de marché significative.
Les niveaux actifs et cassés utilisent des styles visuels distincts, tandis que les limites intégrées maintiennent le graphique propre en contrôlant le nombre de niveaux visibles.
Parce que les pivots ne sont confirmés qu'après la fermeture du nombre requis de chandeliers, la logique de structure est stable et non redessinable.
Caractéristiques Clés
• Détection automatique des Swing Haut / Swing Bas
• Niveaux dynamiques de Support & Résistance
• Marquage automatique de la Rupture de Structure (BOS)
• Filtre de swing minimum pour éliminer le bruit
• Détection optionnelle de rupture sur mèche ou clôture
• Style distinct pour les niveaux actifs vs cassés
• Limites pour les niveaux actifs et historiques pour garder les graphiques propres
• Logique de pivot non redessinable
Idéal Pour
• Trading basé sur l'Action des Prix
• Stratégies de Support & Résistance
• Trading basé sur la liquidité
• Systèmes de Rupture de Structure
• Scalping, trading intraday et swing trading
Résumé
Avis clients
5 | 67 % | |
4 | 33 % | |
3 | 0 % | |
2 | 0 % | |
1 | 0 % |


