present
Inscrivez-vous et bénéficiez d'une remise de 50 $ sur votre premier achat
Trading product for Minibull Location of the Price and Volume Indicateur SMA Key Levels, image 1
Minibull Location of the Price and Volume
Indicateur
Version 1.0, Jul 2026
Windows, Mac
Trading product for Minibull Location of the Price and Volume Indicateur SMA Key Levels, image 2
Trading product for Minibull Location of the Price and Volume Indicateur SMA Key Levels, image 3
Trading product for Minibull Location of the Price and Volume Indicateur SMA Key Levels, image 4
Trading product for Minibull Location of the Price and Volume Indicateur SMA Key Levels, image 5
Trading product for Minibull Location of the Price and Volume Indicateur SMA Key Levels, image 6
Trading product for Minibull Location of the Price and Volume Indicateur SMA Key Levels, image 7

Description

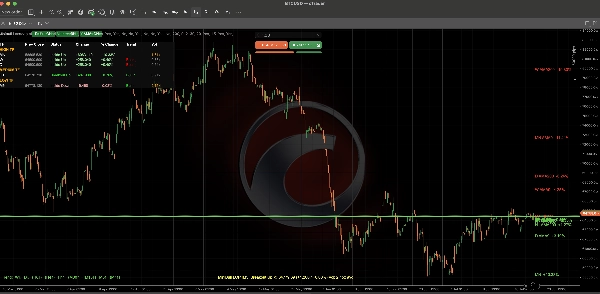
MiniBull Location of the Price (LOP) montre exactement où se situe le prix par rapport à la dernière barre clôturée sur chaque unité de temps importante : Mensuel, Hebdomadaire, Quotidien, H8, H4, H1, M30, M15, M5, M1 (configurable ; cinq actifs par défaut).

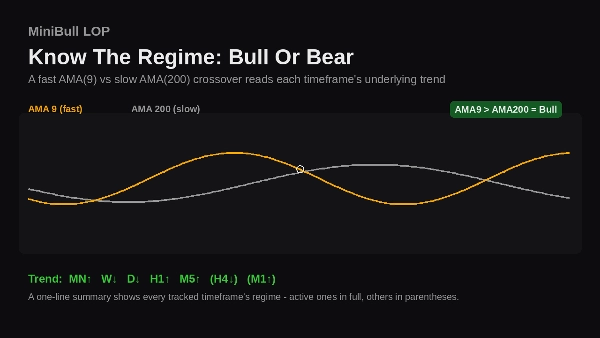
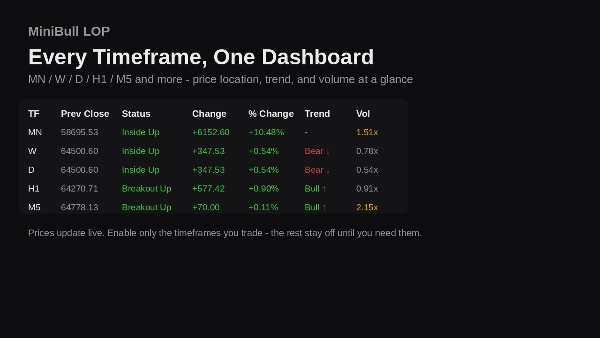
Pour chaque unité de temps : clôture précédente, variation absolue et en %, lecture de tendance haussière/baissière à partir d’un croisement AMA double (9/200), et un ratio tick-volume par rapport à sa propre moyenne, le tout dans un tableau de bord intégré au graphique activable d’un clic.

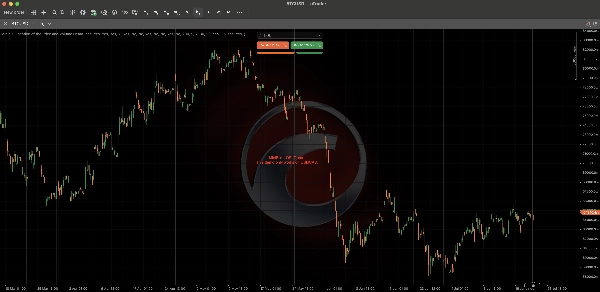
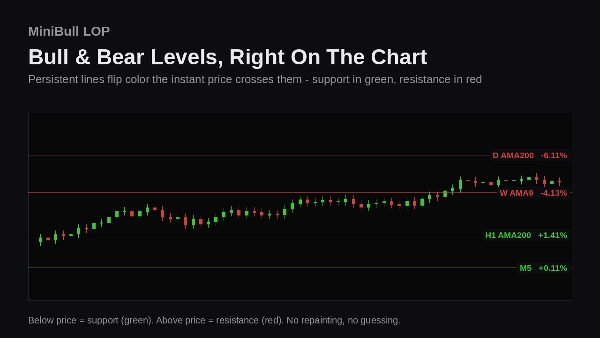
Des lignes persistantes codées par couleur (vert = support, rouge = résistance) marquent chaque niveau sur le graphique et se mettent à jour en temps réel, pour que vous sachiez toujours où se trouve le prix sans ouvrir une fenêtre secondaire.

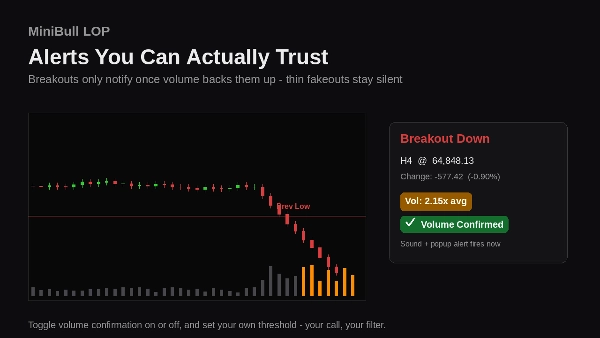
Des alertes de cassure (son + popup) se déclenchent lorsque le prix dépasse un plus haut ou un plus bas précédent, avec option de confirmation par volume, filtrant ainsi les faux signaux faibles et peu convaincants.

Un résumé compact de la tendance en bas du graphique donne une lecture en une ligne de l’humeur du marché sur chaque unité de temps suivie, active ou non.

Conçu pour les traders qui pensent en multi-unités de temps : repérez les alignements, les divergences, ne perdez jamais de vue le prix par rapport à hier, la semaine dernière ou le mois dernier.
Résumé

Résumé IA
Minibull Location of the Price and Volume is a multi-timeframe trading indicator designed to display the current price position relative to the last closed bar across key timeframes including Monthly, Weekly, Daily, and intraday intervals (H8, H4, H1, M30, M15, M5, M1). It provides a compact on-chart dashboard showing previous close, absolute and percentage price changes, a Bull/Bear trend signal derived from a dual Adaptive Moving Average (AMA) crossover (periods 9 and 200), and a tick-volume ratio compared to its average. The indicator features persistent, color-coded support (green) and resistance (red) lines that update live on the chart, enabling quick visual identification of key levels without opening additional windows. Breakout alerts with sound and popup notifications trigger when price surpasses prior highs or lows, with optional volume confirmation to reduce false signals. A concise trend summary at the chart’s bottom offers a one-line market mood overview across all tracked timeframes. This tool is intended for traders analyzing price and volume alignment or divergence across multiple timeframes to maintain situational awareness of price relative to recent closes.
Profil de l'indicateur
Catégorie de l'indicateur
Tendance
Type de résultat
Visualisation
Signaux
Exigences en matière de données
Barres seulement
Volume
Signaux pris en charge
Croisement
Cassure
Dépassement de niveau

Avis clients

0.0
Avis : 0
Avis clients
Il n'y a pas encore d'avis sur ce produit. Vous l'avez déjà essayé ? Soyez le premier à en parler aux autres !

Discussion

Questions fréquentes

SMA
Key Levels
Volume
Moving Average
Support & Resistance
Les produits disponibles sur cTrader Store, notamment les bots de trading, les indicateurs et les plug-ins, sont fournis par des développeurs tiers et mis à disposition à titre informatif et à des fins d'accès technique uniquement. cTrader Store n'est pas un courtier et ne fournit aucun conseil en investissement, aucune recommandation personnelle ni aucune garantie quant aux performances futures.

Plus de cet auteur

Indicateur
CCI
EMA
+5
Streamline your focus. Stop juggling multiple timeframes and view them all on a single char
Indicateur
EMA
Moving Average
+2
Trade the Trend. Ignore the Noise
cBot
Fixed Lot
SL Manager
+5
Minibull AMA Sniper Pro: Filter the noise, secure the trend. Precision entries backed by bulletproof risk management.
1.17
Facteur de profit
Indicateur
ATR
EMA
+3
Trend is your friend. Be Logical
cBot
Channel
Conservative
+3
Trade With the Trend.Enter With Precision.Multi-timeframe logic filters the noise and captures high-probability reversal
1.46
Facteur de profit
Indicateur
SMA
Channel
+2
MiniBull Gold vs Indices is a non-repainting Balance-of-Powers indicator that tracks GOLD against three major indices.
cBot
ATR
Break Even
+4
Four markets, one divergence, one signal. Trade the reversal, manage the risk automatically
1.34
Facteur de profit

Vous pourriez aussi aimer

Indicateur
MSS
VWAP
+5
VWAP mean-reversion signals combined with a ribbon-anchored volume profile, VAH/VAL, POC and HVN levels.
Indicateur
Prop
Forex
+15
Footprint volume indicator showing bid/ask splits at each price level
Indicateur
Ultra-Flexible VWAP Indicator with Advanced Customization
Indicateur
Forex
Crypto
+4
Auto-detect support and resistance & trendlines, highlight pullbacks/BOS retests, and filter with candle confirmation.
Indicateur
BOS
Fibonacci
+4
Market structure, liquidity sweeps, BOS/CHoCH, smart zones and BUY/SELL setups with Entry, SL and TP.
Indicateur
VWAP
Fibonacci
+5
Market Blueprint - SMC/ICT One Indicator. Eleven Core Module, Single Chart , MTF candles, MTF FVG
Indicateur
Volume
Imbalance
+5
Professional OrderFlow Footprint Analysis ( Bid/ask, POC, VA, Delta, Absorption, Imbalance )
Indicateur
ATR
SMC
+9
Advanced SMC/ICT Engine: MTF Structure, Liquidity Sweeps, Real-time Scoring & Pro Risk Dashboard. 100% Non-Repaint
Logo de "Prometheus"
Les mieux notés
4.0
(4)
$99
/
$179
Indicateur
AI
ATR
+15
AI-powered Smart indicator. Dual neural networks self-train on live trades. Liquidity sweep + SMC. All pairs/timeframe.
Indicateur
RSI
MACD
+5
An advanced indicator merging Smart Money Concepts, Gann Sq9 targets, Monte Carlo analysis, and MTF trend bias.
Indicateur
AI
RSI
+19
The HAI Quantum V10 is an advanced indicator designed for technical analysis.
Indicateur
EMA
Channel
+3
Real-time squeeze detection, dual-horizon trend scoring & institutional breakout validation HUD dashboard.
Indicateur
ATR
EMA
+5
Multi-factor volatility squeeze detector, dual-trend scoring & breakout validation dashboard. No repaint.
Indicateur
Liquidity Grab
Liquidity Sweep
+2
Visualizes accumulation ranges, manipulation sweeps and distribution phases on your cTrader chart.
Indicateur
AI
ATR
+27
Imperium MTF Heatmap is a unique top-tier indicator for cTrader, created for traders who want more than signals
Indicateur
Forex
Renko scalping indicator
Indicateur
ATR
BOS
+5
Apex Strike: Multi-timeframe (M5-H1) non-repainting indicator with winrate dashboard & alerts (Gold, BTC).
Indicateur
Prop
Institution-level trend Analyzer.

Prix