
คำอธิบาย
ราคาสูงสุด / ต่ำสุดของวันก่อนหน้า – Virgin Levels Ultimate
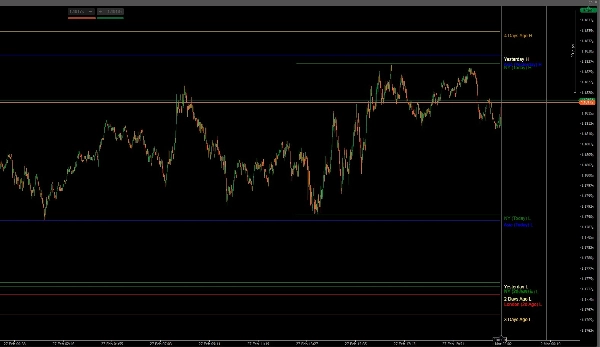
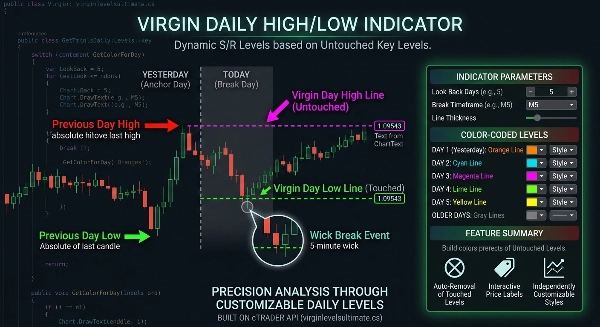
Virgin Levels Ultimate เป็นตัวชี้วัดการติดตามระดับอย่างแม่นยำที่วางจุดสูงสุดและต่ำสุดที่ยังไม่ถูกแตะจากวันซื้อขายก่อนหน้าโดยอัตโนมัติและเก็บไว้บนกราฟของคุณจนกว่าราคาจะทะลุผ่าน
สร้างขึ้นสำหรับเทรดเดอร์ที่เข้าใจว่าระดับสภาพคล่องที่ยังไม่ถูกแตะทำหน้าที่เหมือนแม่เหล็กดึงดูดราคา เครื่องมือนี้ให้กรอบงานที่ชัดเจนและมีโครงสร้างสำหรับการทำเบรกเอาท์และการกลับตัว
ขยายเพิ่มเติมด้วย ราคาสูง/ต่ำของช่วงเอเชีย ลอนดอน และนิวยอร์ก รวมถึง ระดับรายสัปดาห์และรายเดือนก่อนหน้า สร้างแผนที่สภาพคล่องหลายกรอบเวลาที่สมบูรณ์
ออกแบบมาสำหรับ Forex ดัชนี ทองคำ และคริปโต — ครอบคลุมทุกกรอบเวลา
เทรดสภาพคล่องสำคัญ เทรดด้วยความแม่นยำ
⚙ แกนหลัก
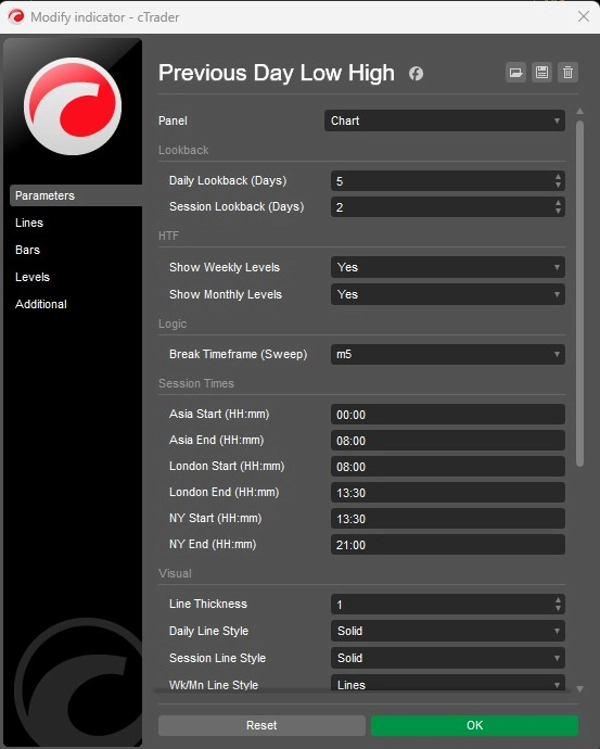
- ตรวจจับราคาสูงสุดและต่ำสุดรายวันก่อนหน้าโดยอัตโนมัติ
- กำหนดช่วงเวลาย้อนหลังรายวันได้ (ติดตามหลายวันก่อนหน้า)
- ตรวจจับราคาสูง/ต่ำของช่วงเอเชีย ลอนดอน และนิวยอร์ก
- ควบคุมการย้อนกลับของช่วงเวลา (ติดตามหลายช่วงเวลาก่อนหน้า)
- ราคาสูง / ต่ำรายสัปดาห์ก่อนหน้า (เลือกใช้ได้)
- ราคาสูง / ต่ำรายเดือนก่อนหน้า (เลือกใช้ได้)
- ระดับจะเริ่มทำงานเฉพาะจากช่วงเวลาการซื้อขายที่ถูกต้องถัดไป
- ลบออกโดยอัตโนมัติเมื่อระดับถูกแตะ (ไม่มีความยุ่งเหยิง)
- ตรวจจับการทะลุผ่านโดยใช้กรอบเวลาที่เลือกได้ที่ต่ำกว่า
- ตรวจสอบระดับแบบเรียลไทม์
📊 หลักการ Virgin Level
- แสดงเฉพาะราคาสูงและต่ำที่ยังไม่ถูกแตะ (virgin)
- แยกระดับรายวัน ช่วงเวลา รายสัปดาห์ และรายเดือนอย่างชัดเจน
- ติดตามหลายวัน (วัน 1 ถึง วัน 5+)
- ติดตามช่วงเวลา (วันนี้, เมื่อวาน, ย้อนหลังแบบกำหนดเอง)
- แยกแยะวันเก่าอย่างชัดเจนด้วยภาพ
- แผนที่แนวรับและแนวต้านแบบไดนามิก
- กรอบงานเบรกเอาท์ที่อิงกับสภาพคล่อง
- โครงสร้างความสอดคล้องหลายกรอบเวลา
🕒 การตรวจจับเบรกอัจฉริยะ
- เลือกกรอบเวลาเบรกได้ (เช่น M5, M15 เป็นต้น)
- ความแม่นยำภายในวันสำหรับการยกเลิกระดับ
- สแกนราคาสูง/ต่ำจากเวลาที่เปิดใช้งานที่ถูกต้อง
- ทำงานได้กับระดับรายวัน ช่วงเวลา รายสัปดาห์ และรายเดือน
- หยุดการวางจุดทันทีหลังจากยืนยันการแตะ
- ตรรกะกราฟที่สะอาด — ไม่มีการวาดซ้ำในอดีต
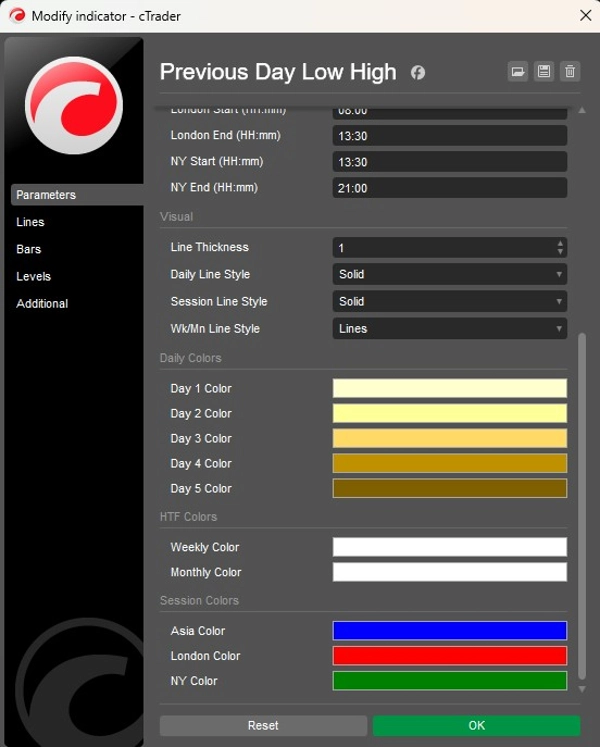
🎨 การปรับแต่งเต็มรูปแบบ
- ควบคุมสีแยกอิสระสำหรับแต่ละช่วงเวลาย้อนหลังรายวัน
- สีเฉพาะสำหรับช่วงเวลาเอเชีย ลอนดอน และนิวยอร์ก
- สีแยกสำหรับระดับรายสัปดาห์และรายเดือน
- ปรับสไตล์เส้นได้ (รายวัน / ช่วงเวลา / HTF)
- ตั้งค่าความหนาได้
- ป้ายราคาสมาร์ทแบบอัตโนมัติพร้อมการจัดเรียงแบบไม่ทับซ้อน
- รูปลักษณ์กราฟที่เรียบง่ายและเป็นมืออาชีพ
🎯 เหมาะสำหรับ
- เทรดเดอร์ที่สแกนสภาพคล่อง
- เทรดเดอร์เบรกเอาท์และเฟคเอาท์
- เทรดเดอร์สไตล์ SMC / ICT
- เทรดเดอร์ตามช่วงเวลา (เอเชีย, ลอนดอน, นิวยอร์ก)
- เทรดเดอร์ภายในวันและสวิง
- ระบบตามกฎของบริษัท Prop firm
- เทรดเดอร์หลายสินทรัพย์ (Forex, ดัชนี, โลหะ, คริปโต)
สรุป
Key features include automatic detection and plotting of prior highs and lows, customizable lookback periods for days and sessions, real-time validation, and automatic removal of levels once touched to reduce chart clutter. It visually distinguishes older levels and separates daily, session, weekly, and monthly levels with independent color and style customization. The tool supports dynamic support and resistance mapping and provides a liquidity-based breakout framework suitable for Forex, indices, gold, cryptocurrencies, and other markets.
This indicator is suitable for liquidity sweep traders, breakout and fakeout strategies, smart money concept (SMC) and institutional trading (ICT) styles, session-based trading, intraday and swing trading, prop firm rule-based systems, and multi-asset trading. It offers a professional, minimal chart appearance with auto price labels and smart stacking.
รีวิวจากลูกค้า
5 | 100 % | |
4 | 0 % | |
3 | 0 % | |
2 | 0 % | |
1 | 0 % |


