
InstitutionalSignalOscillator
อินดิเคเตอร์
1 การซื้อ
เวอร์ชัน 2.1, Dec 2025
Windows, Mac
5.0
รีวิว: 2
คำอธิบาย
🏛️ ตัวสัญญาณสั่นสะเทือนสถาบัน
ความชัดเจนของโมเมนตัมที่ขับเคลื่อนด้วย AI ซึ่งยึดโยงกับข้อมูลเชิงลึกในกรอบเวลาที่สูงกว่า
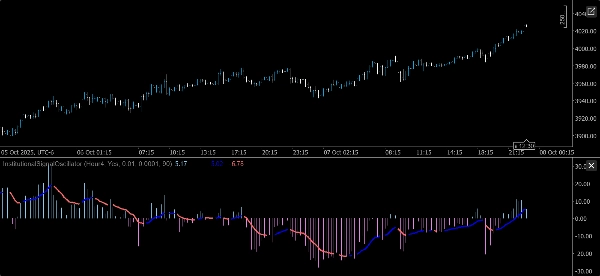
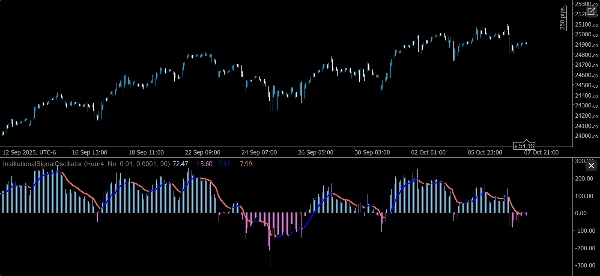
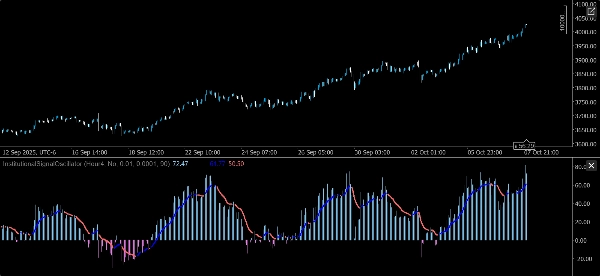
ตัวสัญญาณสั่นสะเทือนสถาบันเป็นตัวบ่งชี้โมเมนตัมรุ่นถัดไปที่ออกแบบมาสำหรับเทรดเดอร์ที่ทำงานในกรอบเวลาต่ำกว่าแต่ต้องการข้อมูลเชิงกลยุทธ์จากโครงสร้างในกรอบเวลาที่สูงกว่า ได้รับแรงบันดาลใจจากความงดงามของสถาปัตยกรรมคลาสสิกและขับเคลื่อนด้วยการสร้างแบบจำลองทางคณิตศาสตร์เชิงลึก มันนำเสนอฮิสโตแกรมที่ละเอียดซึ่งจับทิศทางด้วยความแม่นยำและความสง่างาม
🔍 คุณสมบัติหลัก
- การสกัดสัญญาณด้วย AI
เบื้องหลังผลลัพธ์ที่สะอาดตาคือเครื่องยนต์ประมาณค่าซ้ำที่มีรากฐานจากทฤษฎีการควบคุมขั้นสูงและการสร้างแบบจำลองปรับตัว มันเรียนรู้อย่างต่อเนื่องจากพฤติกรรมราคา กรองเสียงรบกวนในขณะที่รักษาโมเมนตัมที่นำไปใช้ได้ - การยึดโยงกับกรอบเวลาที่สูงกว่า
แม้จะใช้ในกรอบเวลาที่ต่ำกว่า (M5, M15, M30) ตัวสั่นสะเทือนนี้ดึงสัญญาณจาก โครงสร้าง ในกรอบเวลาที่สูงกว่า เพื่อให้แน่ใจว่าการตัดสินใจระยะสั้นมีพื้นฐานจากบริบทตลาดที่กว้างขึ้น ซึ่งสร้าง ความสมดุลระหว่างความคล่องตัวเชิงยุทธวิธีและการจัดแนวเชิงกลยุทธ์. - ผลลัพธ์ฮิสโตแกรมคู่
-
- โมเมนตัมบวก: เน้นด้วยสีทองหรือสีเขียว
- โมเมนตัมลบ: ทำเครื่องหมายด้วยสีแดงเข้มหรือสีน้ำเงินกรมท่า
- ฮิสโตแกรมสะท้อนพลวัตราคาที่ผ่านการกรอง ไม่ใช่เดลต้าดิบ — มอบสัญญาณที่ราบรื่นและเชื่อถือได้มากขึ้น
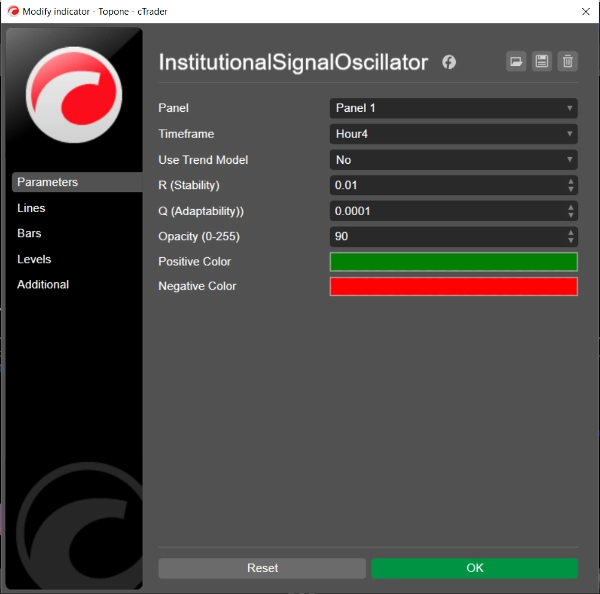
- การเลือกแบบจำลอง
เลือกได้ระหว่าง: -
- โหมดรับรู้แนวโน้ม: สมมติการลอยตัวในทิศทาง เหมาะสำหรับการตั้งค่าสวิง
- โหมดเป็นกลาง: มุ่งเน้นที่การกลับสู่ค่าเฉลี่ยและความผันผันระยะสั้น
- การควบคุมพารามิเตอร์
- 10^Q (ความสามารถในการปรับตัว): ควบคุมความเร็วที่แบบจำลองตอบสนองต่อการเปลี่ยนแปลง
- 10^R (ความเสถียร): ปรับความทนทานต่อเสียงรบกวนในตลาด
พารามิเตอร์เหล่านี้ช่วยให้เทรดเดอร์ปรับแต่งพฤติกรรมของตัวสั่นสะเทือนได้ให้ตรงกับกลยุทธ์และประเภทสินทรัพย์ของตน
🧠 ประโยชน์เชิงกลยุทธ์
- การลดเสียงรบกวน: กรองความวุ่นวายภายในแท่งเทียนในขณะที่รักษาโครงสร้างสัญญาณ
- การรับรู้สภาพแวดล้อม: ทำงานร่วมกับตัวจำแนกความผันผวน, ชั้น IB และตรรกะช่วงเวลาได้อย่างราบรื่น
- วินัยในการดำเนินการ: ส่งเสริมการจัดแนวกับความลำเอียงในกรอบเวลาที่สูงกว่า ลดการเทรดที่เกิดจากอารมณ์ชั่ววูบ
- การรวมชุดเครื่องมือ: สร้างขึ้นเพื่อการใช้งานแบบโมดูลาร์ในครอบครัวตัวบ่งชี้ที่มีแบรนด์
สรุป
สรุปโดย AI
The Institutional Signal Oscillator is an AI-powered momentum indicator designed for traders operating on lower timeframes (M5, M15, M30) who require insights anchored in higher-timeframe market structure. It uses advanced control theory and adaptive modeling to extract clean, noise-filtered momentum signals, presented as a dual-color histogram indicating positive (gold/green) and negative (crimson/navy) momentum. The oscillator offers two model modes: Trend-Aware, which assumes directional drift suitable for swing trading, and Neutral, which focuses on mean-reversion and short-term price fluctuations. Adjustable parameters control the model’s adaptability and stability, allowing customization to different strategies and asset classes. The indicator emphasizes noise suppression, regime awareness by integrating with volatility classifiers and session logic, and promotes disciplined execution aligned with broader market trends. It is designed for modular deployment within indicator suites and supports markets including Forex, indices, and commodities with symbols such as EURUSD, GBPUSD, XAUUSD, and NAS100.
โปรไฟล์อินดิเคเตอร์
รีวิวจากลูกค้า
5.0
รีวิว: 2
5 | 100 % | |
4 | 0 % | |
3 | 0 % | |
2 | 0 % | |
1 | 0 % |
รีวิวจากลูกค้า
การสนทนา
คำถามที่พบบ่อย
Forex
Signal
Indices
EURUSD
Commodities
GBPUSD
AI
XAUUSD
NAS100
MACD
ผลิตภัณฑ์ที่มีให้บริการผ่าน cTrader Store รวมถึงบอทการเทรด อินดิเคเตอร์ และปลั๊กอิน มีให้บริการโดยนักพัฒนาบุคคลที่สามและมีไว้เพื่อวัตถุประสงค์ในการเข้าถึงข้อมูลและทางเทคนิคเท่านั้น cTrader Store ไม่ใช่โบรกเกอร์และไม่ได้ให้คำแนะนำการลงทุน คำแนะนำส่วนบุคคล หรือการรับประกันผลการดำเนินงานในอนาคต


ราคา
25
การขาย
2.12K
ติดตั้งฟรี