คำอธิบาย
📈 pATR – Percentile Average True Range
ความผันผวนที่แม่นยำ ความเสี่ยงที่ชาญฉลาด ข้อได้เปรียบของสถาบัน
ตัวชี้วัด pATR นิยามใหม่ ATR แบบดั้งเดิมโดยใช้ตัวกรองแบบเปอร์เซ็นไทล์กับค่าช่วงจริงล่าสุด เพื่อให้เทรดเดอร์มีมุมมองที่มีพื้นฐานทางสถิติของความผันผวน แทนที่จะพึ่งพาค่าเฉลี่ยง่าย ๆ pATR คำนวณ เปอร์เซ็นไทล์ที่ n ของความเข้มข้นการเคลื่อนไหวราคาล่าสุด — ช่วยให้คุณระบุโซนเบรกเอาต์ การตั้งค่าฟีด และเกณฑ์ความเสี่ยงได้อย่างแม่นยำ
ไม่ว่าคุณจะกำลังเผชิญกับความท้าทายของบริษัทโพรพหรือปรับกลยุทธ์สแคปปิ้งของคุณ pATR มอบมาตรฐานความผันผวนที่ปรับตัวได้ตามสภาพตลาดและช่วยให้ความเสี่ยงของคุณถูกปรับอย่างเหมาะสม
🔍 คุณสมบัติหลัก
• ATR แบบเปอร์เซ็นไทล์: กรองเสียงรบกวนและเหตุการณ์หางเพื่อสัญญาณความผันผวนที่ชัดเจนขึ้น
• ตรรกะบัฟเฟอร์วงกลม: เพิ่มประสิทธิภาพด้านความเร็วและหน่วยความจำ — ไม่มีความล่าช้า ไม่มีความยุ่งเหยิง
• พร้อมสำหรับโหมดความท้าทาย: เหมาะสำหรับเทรดเดอร์โพรพที่จัดการการลดลงและขีดจำกัดการเทรด
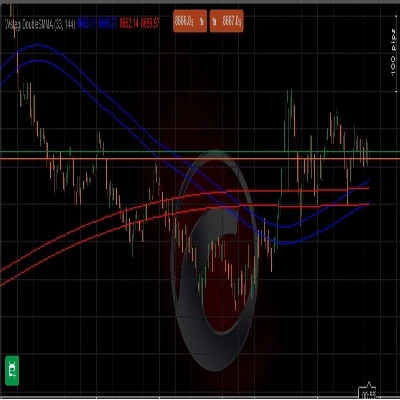
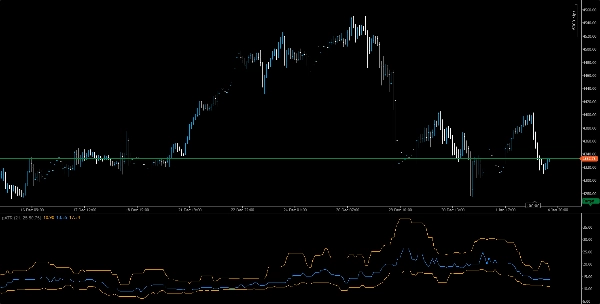
• ภาพที่ชัดเจน: เส้นความผันผวนสีส้มพร้อมตัวเลือกการปรับขนาดและการซ้อนทับที่เข้าใจง่าย
• รองรับหลายกรอบเวลา: ใช้ได้ตั้งแต่ M1 ถึง H1 สำหรับการตั้งค่าเบรกเอาต์ ฟีด หรือแนวโน้ม
🧠 กรณีการใช้งาน
• ยืนยันเบรกเอาต์: ใช้พีกของ pATR เพื่อยืนยันการเข้าทำโมเมนตัม
• การปรับความเสี่ยง: ปรับจุดหยุดขาดทุนและขนาดตำแหน่งให้สอดคล้องกับความผันผวนแบบเปอร์เซ็นไทล์
• การทดสอบกลยุทธ์ย้อนหลัง:ยืนยันการตั้งค่าด้วยเกณฑ์ความผันผวนที่สม่ำเสมอ
🎯 เหมาะสำหรับใคร
• เทรดเดอร์โพรพที่ต้องการการควบคุมความเสี่ยงตามกฎ
• นักสแคปและนักวางกลยุทธ์ภายในวันที่ต้องการตัวกรองความผันผวนที่ปรับตัวได้
• เทรดเดอร์เชิงปริมาณที่ผสานตรรกะเปอร์เซ็นไทล์เข้ากับระบบที่กำหนดเอง
• ครูและที่ปรึกษาที่สอนการดำเนินการที่ตระหนักถึงความผันผวน
สรุป
Key features include an orange volatility line with intuitive scaling and overlay options, compatibility across multiple timeframes from 1-minute to 1-hour charts, and suitability for prop firm traders managing drawdowns and trade limits. pATR helps traders identify breakout zones, fade setups, and risk thresholds with precision.
Use cases cover breakout confirmation through volatility spikes, risk calibration by aligning stop-loss and position sizing with percentile volatility, and strategy backtesting using consistent volatility benchmarks. The indicator is designed for prop firm traders, scalpers, intraday strategists, quantitative traders integrating percentile logic, and educators focusing on volatility-aware execution.
Supported markets include Forex, stocks, indices, commodities, and cryptocurrencies, making pATR a versatile tool for various trading environments.