
present
ลงทะเบียนและรับส่วนลด $50 สำหรับการซื้อครั้งแรกของคุณ
Trading product for Liquidity & Structure (SMC) Pro อินดิเคเตอร์ Fair Value Gap BOS, image 1
Liquidity & Structure (SMC) Pro
อินดิเคเตอร์
4 การซื้อ
เวอร์ชัน 2.0, Aug 2026
Windows, Mac
Trading product for Liquidity & Structure (SMC) Pro อินดิเคเตอร์ Fair Value Gap BOS, image 2
Trading product for Liquidity & Structure (SMC) Pro อินดิเคเตอร์ Fair Value Gap BOS, image 3
Trading product for Liquidity & Structure (SMC) Pro อินดิเคเตอร์ Fair Value Gap BOS, image 4
Trading product for Liquidity & Structure (SMC) Pro อินดิเคเตอร์ Fair Value Gap BOS, image 5
Trading product for Liquidity & Structure (SMC) Pro อินดิเคเตอร์ Fair Value Gap BOS, image 6
30.48M
ปริมาณการเทรด
12.32K
Pips ที่ได้กำไร
25
การขาย
2.1K
ติดตั้งฟรี

คำอธิบาย

เอกสารฉบับเต็ม การตั้งค่าทุกอย่าง และข้อมูลทั้งหมดอย่างละเอียดบนเว็บไซต์ของเรา - realbacktesting.com


Liquidity & Structure (SMC) (Pro) — ชุดสมบูรณ์ของ Smart-Money-Concepts สำหรับ cTrader ไม่มีการรีเพนท์ และมันวัดตัวเองได้


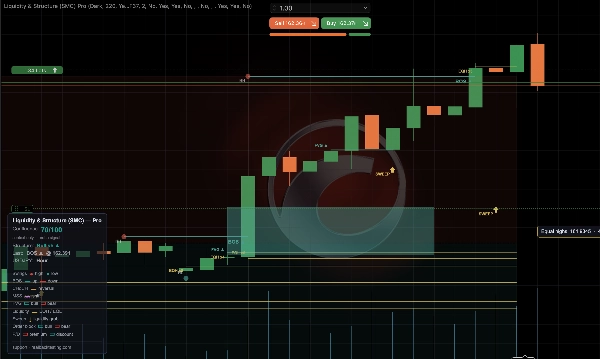
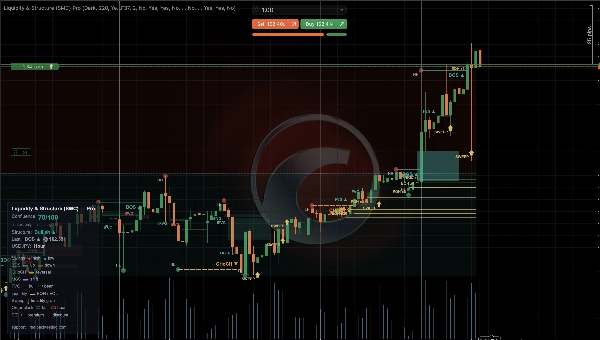
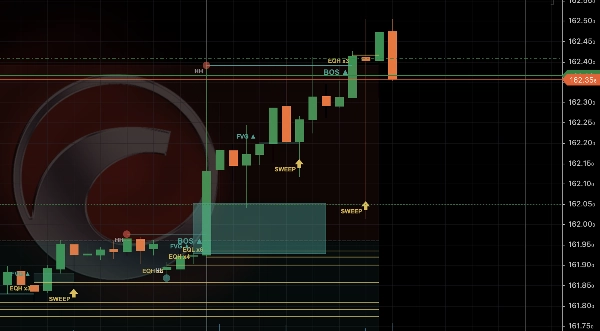
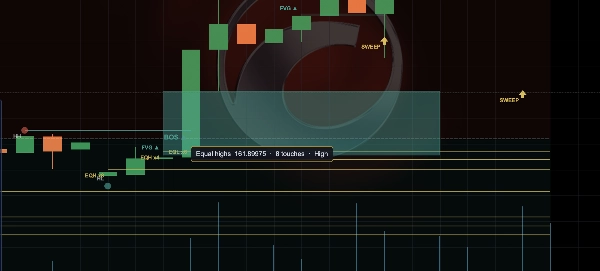
อินดิเคเตอร์ที่สะอาดหนึ่งตัววาดภาพ SMC ทั้งหมด: โครงสร้างตลาด (BOS / CHoCH / MSS), ช่องว่างมูลค่ายุติธรรม, สระสภาพคล่องและการกวาดล้าง, บล็อกคำสั่ง, พรีเมียม/ส่วนลด — และคะแนนความสอดคล้อง 0–100 เพื่อให้คุณเห็นได้ทันทีเมื่อทุกอย่างตรงกัน ทุกองค์ประกอบมีคำแนะนำราคาที่คลิกได้ มันไม่เคยรีเพนท์ และมันตอบคำถามที่เครื่องมือ SMC อื่น ๆ ทิ้งไว้: นี่ใช้งานได้จริงบนชาร์ตของฉันหรือไม่?


สิ่งที่มันทำ

✅ โครงสร้างตลาด — BOS / CHoCH / MSS, ป้ายกำกับอัตโนมัติ

✅ ช่องว่างมูลค่ายุติธรรม — วาด, ติดตามสถานะเติมเต็ม, FVG ผกผัน, ตัวกรองขนาดขั้นต่ำ

✅ สภาพคล่อง — สูง/ต่ำเท่ากัน, การกวาดล้างหยุดล่าโดยมีการยืนยันการปฏิเสธไส้เทียน

✅ บล็อกคำสั่ง — พร้อมตัวกรองการเลื่อนตำแหน่งและคุณภาพของแท่งเทียน

✅ พรีเมียม / ส่วนลด — ตำแหน่งราคาภายในช่วงสวิงปัจจุบัน

✅ โครงสร้างหลายกรอบเวลา — อ่านกรอบเวลาที่สูงกว่าโดยไม่ต้องออกจากชาร์ต

✅ คะแนนความสอดคล้อง 0–100 — บริบท, ไม่ใช่ตัวกระตุ้นการเข้า

✅ คำแนะนำราคาที่คลิกได้ — ระดับที่แม่นยำในทุกองค์ประกอบ

✅ ไม่มีการรีเพนท์ · สี, ความกว้าง, ความทึบ และเลเยอร์ที่ปรับแต่งได้

✅ การแจ้งเตือน — ป๊อปอัพ, เสียง, อีเมล และ Telegram, ต่อเหตุการณ์


ความน่าเชื่อถือที่วัดได้ — สิ่งที่ไม่มีอะไรในหมวดนี้ทำได้

บนแท่งเทียนของคุณเอง มันนับจำนวนครั้งที่ราคาตอบสนองที่บล็อกคำสั่ง ช่องว่าง และการกวาดล้างแต่ละจุด และพิมพ์อัตราข้างขนาดตัวอย่าง จากนั้นมันไปไกลกว่านั้น:

▸ แยกตามเซสชัน — สามเซสชัน, หน้าต่างของคุณเอง, อ่านแต่ละตลาดตามนาฬิกาของตลาดนั้น ๆ เพื่อให้มีการปรับเวลาฤดูร้อนให้คุณ

▸ การปรับเทียบอัตโนมัติ — มันสแกนการตั้งค่าเลื่อนตำแหน่ง/คุณภาพแท่งเทียน 12 แบบและรายงานค่าที่ดีที่สุดสำหรับสัญลักษณ์ของคุณพร้อมกับค่ามัธยฐานของการสแกน ค่าที่ดีที่สุดที่สูงกว่ามัธยฐานมากคือความแปรปรวน ไม่ใช่ข้อได้เปรียบ และตอนนี้คุณสามารถเห็นความแตกต่างได้

▸ การเปรียบเทียบการเข้า FVG — ขอบเขตใกล้เคียงกับการรอ 50%, หยุดเท่ากัน, แสดงอัตราทั้งสอง

▸ ความล่าช้าในการสัมผัส — เปอร์เซ็นไทล์ที่ 50 / 75 / 90 ของเวลาที่ใช้ในการโดนระดับ

▸ ตัวกรองคุณภาพที่หยุดการวาดบล็อกคำสั่งที่มีอัตราการโดนต่ำกว่าที่วัดได้


นี่คือการนับการตอบสนองของราคาในแท่งเทียนที่ปิดแล้ว: ไม่มีการเข้า ไม่มีการหยุด ไม่มีค่าใช้จ่าย ไม่ใช่ผลลัพธ์ของกลยุทธ์ — เป็นตัวเลขที่คุณสามารถทำซ้ำได้


ทำไมมันจึงเพิ่มคุณค่า

เครื่องมือ SMC ส่วนใหญ่จะวาดเพียงหนึ่งหรือสองอย่างและรีเพนท์ส่วนที่เหลือ นี่คือชุดเต็มในเลเยอร์เดียวที่ไม่มีการรีเพนท์ พร้อมพารามิเตอร์ 80 ตัวที่แต่ละตัวอธิบายตัวเองในแผงควบคุม — และเหนือสิ่งอื่นใด ด้วยความซื่อสัตย์ในการวัดโซนของตัวเองแทนที่จะขอให้คุณเชื่อใจ


ราคา

29 ดอลลาร์ — จ่ายครั้งเดียว ใช้ได้ตลอดชีพ ไม่มีการสมัครสมาชิก ไม่มีการเช่า


มีรุ่นฟรีให้ใช้งาน — โครงสร้าง ช่องว่าง บล็อกคำสั่ง สภาพคล่อง พรีเมียม/ส่วนลด และการวัด — เพื่อให้คุณลองใช้บนชาร์ตของคุณก่อน: ctrader.com/products/4702


วิธีใช้

1. เพิ่มไปยัง cTrader → ชาร์ต → ตัวชี้วัด → "Liquidity & Structure (SMC)"

2. รอสักครู่เพื่อโหลดประวัติให้การวัดสมบูรณ์

3. อ่าน "การตั้งค่าที่ดีที่สุดที่นี่" และใช้กับสัญลักษณ์ของคุณ

4. คลิกที่องค์ประกอบใดก็ได้เพื่ออ่านราคาที่แม่นยำ มันทำแผนที่ชาร์ตแบบสดและไม่เคยรีเพนท์


== สิ่งที่จะเกิดขึ้นต่อไป ==

อินดิเคเตอร์นี้ทำแผนที่และวัด มันไม่ได้กำหนดขนาด หยุด หรือรอแทนคุณ — นั่นคืออีกครึ่งหนึ่ง และเป็นสิ่งที่ cBots ในพอร์ตโฟลิโอของเราทำงานอัตโนมัติ พร้อมความเท่าเทียมกันของ Python/C# ที่ได้รับการยืนยันและผลลัพธ์ที่ติดตามแบบสดโดย cTrader:

👉 Balanced FTMO Swing รุ่นฟรี ทดสอบย้อนหลังด้วยค่าใช้จ่ายของคุณเอง: ctrader.com/products/4615


สรุป

AI summary
Liquidity & Structure (SMC) Pro is a comprehensive Smart Money Concepts indicator designed for the cTrader platform. It integrates multiple market analysis elements into a single, no-repaint overlay, including market structure components such as Break of Structure (BOS), Change of Character (CHOCH), and Market Structure Shifts (MSS). The indicator automatically labels these structures and visually represents fair-value gaps (FVG) with tracked fill states.

It identifies liquidity pools, sweeps, and grabs, highlighting stop-run events, and marks bullish and bearish order blocks. A unique feature is the 0–100 confluence score, which quantifies the alignment of various SMC signals to help users quickly assess the strength of combined market factors. Each structural element, order block, and fair-value gap includes on-click price tooltips for precise level reading.

The indicator is configurable, allowing customization of colors, widths, opacity, and which elements to display. It operates live on charts without repainting, ensuring that displayed signals remain consistent after they appear. This tool consolidates the full SMC suite into one interface, facilitating detailed market structure analysis and liquidity assessment for traders using cTrader.

โปรไฟล์อินดิเคเตอร์
หมวดหมู่อินดิเคเตอร์
โครงสร้างตลาด (SMC)
ประเภทเอาต์พุต
การแสดงเป็นภาพ
สัญญาณ
ข้อกำหนดด้านข้อมูล
แท่งเท่านั้น
ข้อมูล Tick
สัญญาณที่รองรับ
เบรก Level ที่ระบุ
แตะ Level ที่ระบุ

รีวิวจากลูกค้า

0.0
รีวิว: 0
รีวิวจากลูกค้า
ยังไม่มีรีวิวสำหรับผลิตภัณฑ์นี้ หากเคยลองแล้ว ขอเชิญมาเป็นคนแรกที่บอกคนอื่น!

การสนทนา

คำถามที่พบบ่อย

Fair Value Gap
BOS
Liquidity Sweep
CHOCH
ผลิตภัณฑ์ที่มีให้บริการผ่าน cTrader Store รวมถึงบอทการเทรด อินดิเคเตอร์ และปลั๊กอิน มีให้บริการโดยนักพัฒนาบุคคลที่สามและมีไว้เพื่อวัตถุประสงค์ในการเข้าถึงข้อมูลและทางเทคนิคเท่านั้น cTrader Store ไม่ใช่โบรกเกอร์และไม่ได้ให้คำแนะนำการลงทุน คำแนะนำส่วนบุคคล หรือการรับประกันผลการดำเนินงานในอนาคต

เพิ่มเติมจากผู้เขียนคนนี้

อินดิเคเตอร์
BOS
CHOCH
+2
Free SMC on your chart: BOS / CHoCH / MSS structure and fair-value gaps. No repaint, and it measures itself.
cBot
Balanced
TP Manager
+5
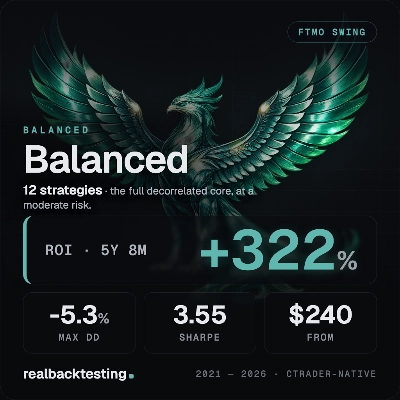
12-strategy portfolio. +322.2% in 5Y8M at -5.26% max DD. No grid. No martingale. Verify every result in your cTrader.
1.67
อัตราส่วน กำไรต่อขาดทุน
cBot
ATR
Aggressive
+5
FREE backtest-only. Reproduce Pegasus Gold's +156.13% in your own cTrader. Same engine, same book. No grid.
2.33
อัตราส่วน กำไรต่อขาดทุน
cBot
Prop Firm Fit
Drawdown Guard
+5
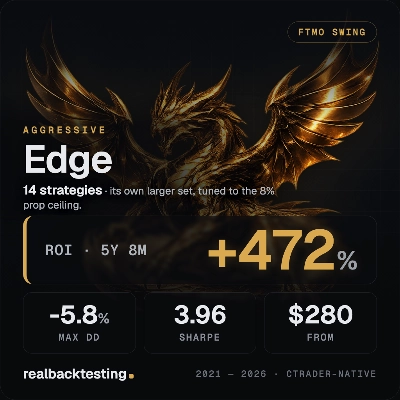
14-strategy portfolio. +472.4% in 5Y8M at -5.78% max DD. No grid. No martingale. Verify every result in your cTrader.
1.64
อัตราส่วน กำไรต่อขาดทุน
อินดิเคเตอร์
Key Levels
Market Structure
+1
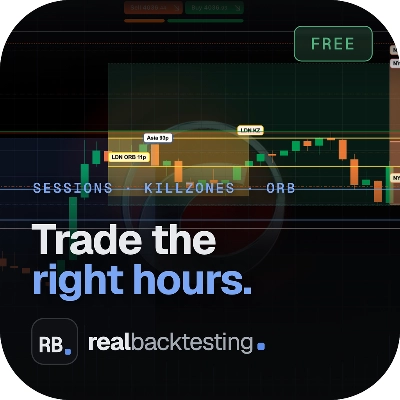
Free: Asia / London / NY sessions, ICT killzones and the opening range. One clean, no-repaint cTrader overlay.
อินดิเคเตอร์
Key Levels
Market Structure
+1
Sessions, ICT killzones, multi-ORB and previous levels. One clean, no-repaint cTrader overlay.
cBot
SL Manager
Break Even
+5
FREE backtest-only. Reproduce Edge's +472.4% in your own cTrader. Same engine, same book. No grid, no martingale.
1.64
อัตราส่วน กำไรต่อขาดทุน
cBot
ATR
Aggressive
+5
8-strategy portfolio. +434.98% in 2Y6M at -17.46% max DD. No grid. No martingale. Verify every result in your cTrader.
1.57
อัตราส่วน กำไรต่อขาดทุน
cBot
ATR
Balanced
+5
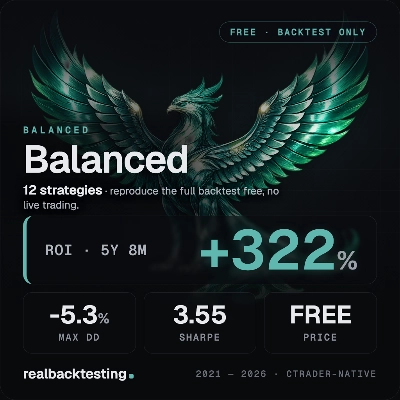
FREE backtest-only. Reproduce Balanced's +322.2% in your own cTrader. Same engine, same book. No grid, no martingale.
1.67
อัตราส่วน กำไรต่อขาดทุน
ปลั๊กอินเดสก์ท็อป
Market Scanner
An 8-currency strength ranking, multi-TF heatmap and impulse tracker. Read the real driver at a glance. Read-only.
cBot
ATR
Aggressive
+5
FREE backtest-only. Reproduce Pegasus Nasdaq's +434.98% in your own cTrader. Same engine, same book. No grid.
1.57
อัตราส่วน กำไรต่อขาดทุน
cBot
ATR
Aggressive
+5
11-strategy portfolio. +156.13% in 2Y6M at -8.48% max DD. No grid. No martingale. Verify every result in your cTrader.
2.33
อัตราส่วน กำไรต่อขาดทุน

นอกจากนี้คุณยังอาจชอบ

อินดิเคเตอร์
Volume
Imbalance
+1
Volume profile indicator that auto-detects the latest trendline. Shows POC, Value Area (VAH/VAL), and High Volume Nodes
อินดิเคเตอร์
Volume
Key Levels
Dynamic Visible Range Volume Profile for cTrader. Real-time POC, Value Area & Smart Alerts for precise trading.
"Institutional Bubbles" โลโก้
ยอดนิยม
4.5
(2)
$38
/
$50
อินดิเคเตอร์
VWAP
Volume
+3
Track hidden trading activities to be on the right side of the market.
อินดิเคเตอร์
This indicator can be used to: change color, shape size, position, change font, increase or decrease, and other function
อินดิเคเตอร์
Forex
BTCUSD
+11
📈 Adaptive ALMA-Gaussian hybrid trend filter with precision smoothing and clear buy/sell signals.
อินดิเคเตอร์
Drawdown Monitor
Protect your funded account. Real-time Daily Equity Drawdown monitor with Green / Orange / Red flashing alerts.
อินดิเคเตอร์
Volume
Custom range volume profile between two draggable anchors. Auto source timeframe, Total/Up-Down/Delta, POC, Value Area.
"Parabolic RSI Alert  V1" โลโก้
ยอดนิยม
4.7
(4)
$19
อินดิเคเตอร์
Master RSI reversals with Parabolic SAR precision! Get real-time alerts for high-probability trend changes.
อินดิเคเตอร์
RSI
RSI on the main chart with 45/55 momentum levels, overbought/oversold levels, averaged RSI, and multi-timeframe support.
อินดิเคเตอร์
ATR
Upgrade to ATR-RMA! Experience the precise ATR using Relative Moving Average for accurate volatility analysis in cTrader
อินดิเคเตอร์
BOS
Add standard-timeframe context candles to a native Renko chart.
"SCOB" โลโก้
เรตติ้งสูง
4.4
(5)
$19
/
$20
อินดิเคเตอร์
SMC
Prop
+12
SCOB - Single Candle Order Block Indicator
อินดิเคเตอร์
ATR
Prop
+6
🟢 Strength-ranked S/R zones with MTF levels and Pro labels. Nearest-zone band and HUD for faster, cleaner entries. 🔴
"TrendPulse VWAP" โลโก้
ยอดนิยม
5.0
(2)
$25
/
$49
อินดิเคเตอร์
ATR
VWAP
+4
Structure-aware indicator that re-anchors VWAP to confirmed swing pivots.
อินดิเคเตอร์
ATR
Forex
+11
Elliott Wave 2 indicator with Markov probability analysis and a confidence score to assess Wave 3 continuation quality.
"Smart Money Gaps" โลโก้
ยอดนิยม
4.6
(5)
$20
/
$40
อินดิเคเตอร์
AI
ATR
+27
Smart Money Gaps: MTF FVG auto-detection, extension, and mitigation marker. Trade institutional imbalances.
อินดิเคเตอร์
Forex
Signal
+4
Gann Pivot Vision is an innovative analytical tool that combines classic pivot reversal levels and Gann geometry
"Hull Moving Average Colored" โลโก้
ยอดนิยม
4.2
(4)
$19
อินดิเคเตอร์
Forex
BTCUSD
+8
The traditional Hull Moving Average with different colours based on the slope (direction) of the trend.

ราคา

30.48M
ปริมาณการเทรด
12.32K
Pips ที่ได้กำไร
25
การขาย
2.1K
ติดตั้งฟรี